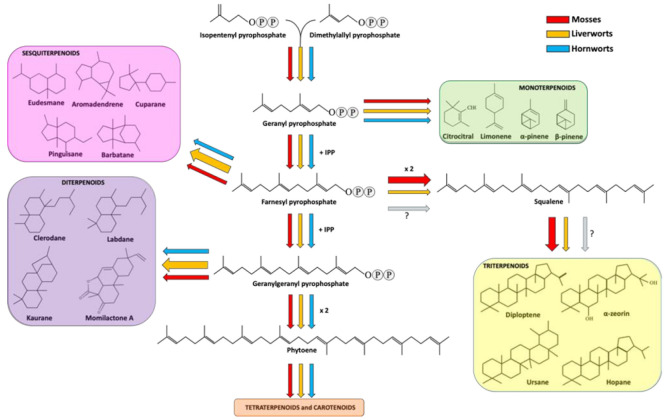
Figure 1.
Terpenoid biosynthetic pathway in bryophytes. Red, orange and cyan arrows indicate the metabolic fluxes observed in mosses, liverworts and hornworts, as suggested in various reports (see references in the main text). Arrow thickness represents the amount of carbon streams (resources) committed for the production of specific metabolites in a specific bryophyte division. The question marks next to the faint arrows state that no information is available about the production of squalene and triterpenoid in hornworts.

