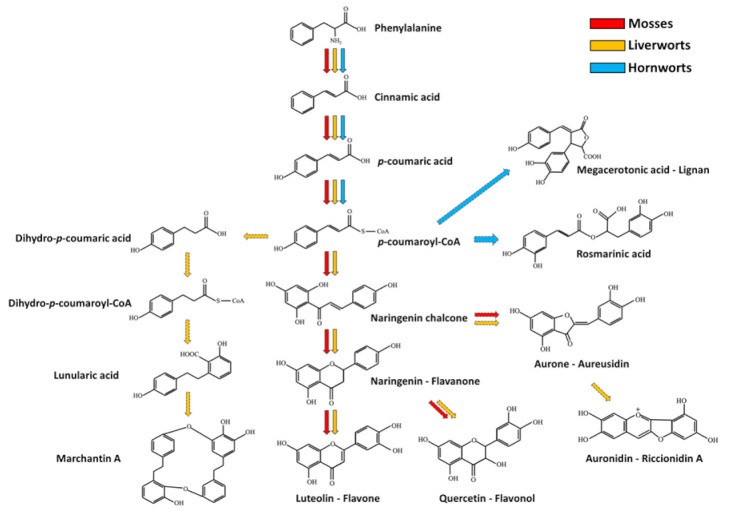
Figure 2.
Simplified phenylpropanoid pathway and some of its putative branches in bryophytes. Red, orange and cyan arrows indicate the metabolic fluxes observed in mosses, liverworts and hornworts respectively, as suggested in various reports (see references in the main text). Dashed arrows indicate multiple reaction steps between the precursor and product.

