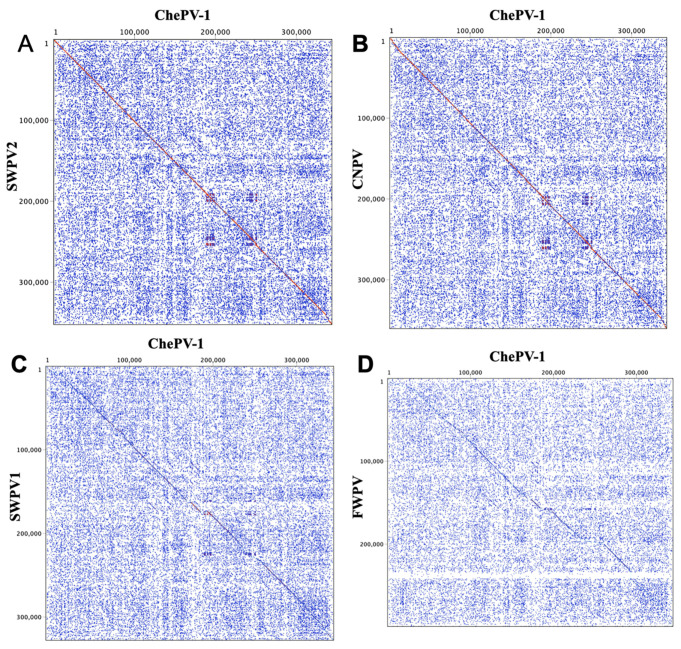
Figure 3.
Dot plots of the ChePV-1 genome (x-axis) vs. other selected sequenced poxvirus genomes (y-axis). (A) ChePV-1 vs SWPV2, (B) ChePV-1 vs canarypox virus (CNPV) (C) ChePV-1 vs shearwaterpox virus-1 (SWPV1) and (D) ChePV-1 vs fowlpox virus (FWPV). The Classic color scheme was chosen in Geneious (version 10.2.2) for the dot plot lines according to the length of the match, from blue for short matches, to red for matches over 100 bp long. Window size = 12.

