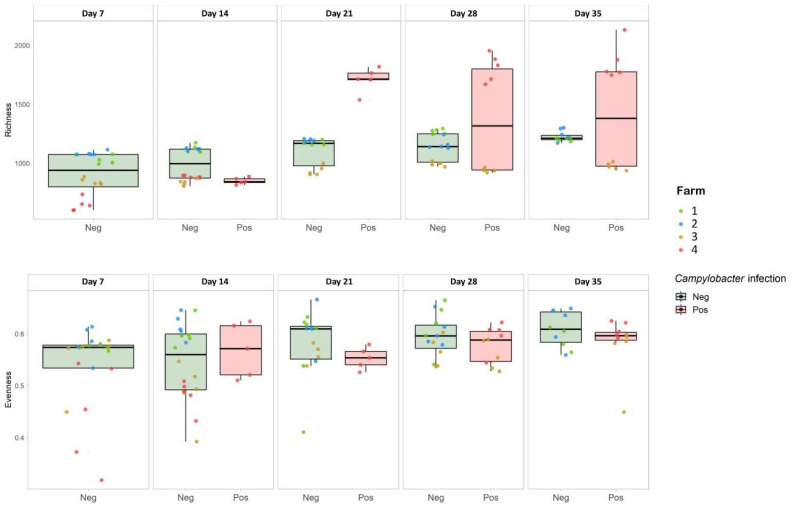
Figure 2.
Alpha diversity analysis in terms of OTU richness (top) and Pielou index (bottom). Results are divided according to whether the sample was positive or negative for Campylobacter. Green box plots were constructed from negative samples’ alpha diversity results, red box plots were constructed from positive samples’ alpha diversity results. The single values related to each sample are shown as points colored according to the farm to which they belonged.

