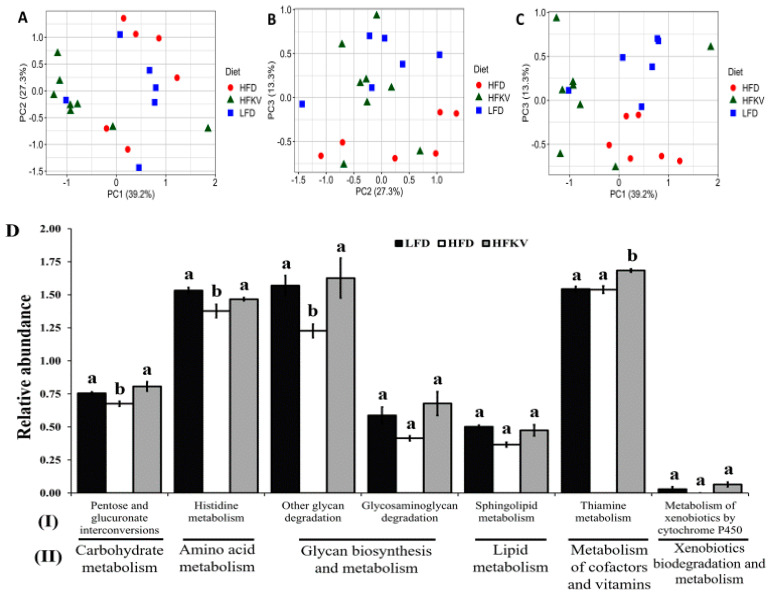
Figure 4.
Predicted metabolic pathways by PICRUSt2 using 16s rRNA gene sequences. (A–C) PCA plots representing the pathways predicted from Kyoto Encyclopedia of Genes and Genomes (KEGG) Ortholog (KO) database. Data points represents the distribution of principal components in two different directions (x- and y-axis) and the closer the data points, the closer the relationship between the samples. HFKV clustered closer to LFD; (D) Microbiota metabolic functions showing significant differences between HFD and HFKV. Significant differences with LFD-induced pathways are indicated by different letters (p < 0.05). (I) KEGG pathways at level 1; (II) KEGG pathways at level 2. The letters ‘a’ ‘b’ denote statistically significant values at p < 0.05.

