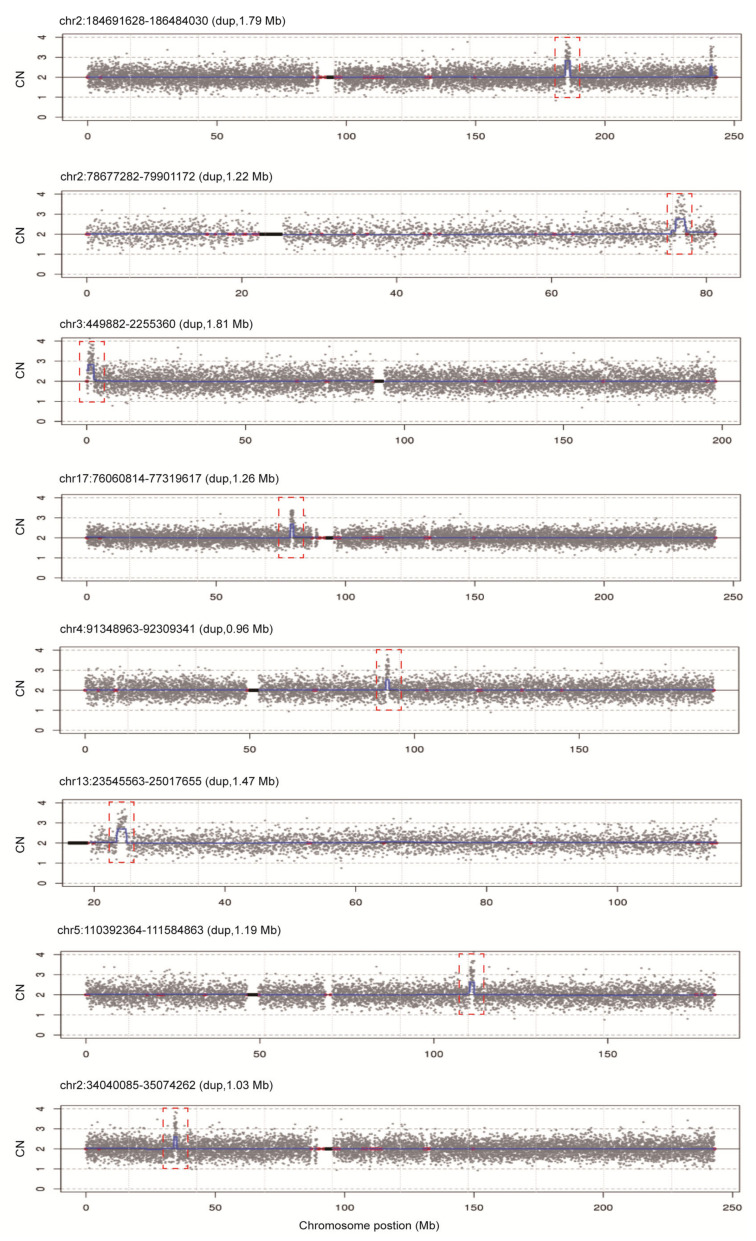
Figure 7.
rCNV-seq detection of CNVs in 217 clinical samples. All CNVs identified were classified as VOUS. Y-axis copy number and X-axis mean copy number of the sequencing bins (gray dots). Blue line signifies the mean copy along the length of the chromosome. Red line indicates regions of repetitive DNA, and the black box denotes the centromere.

