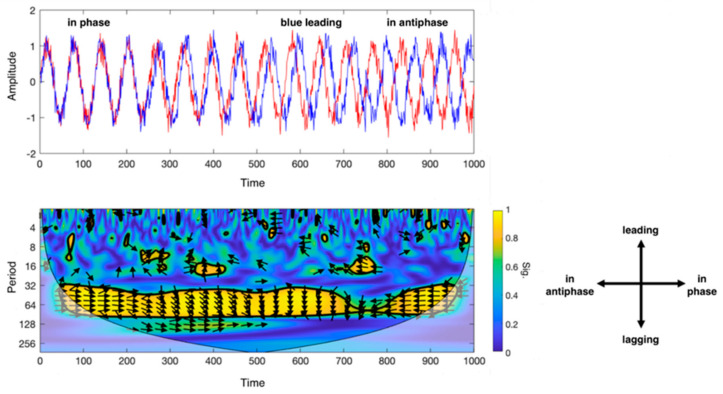
Figure 2.
Description of the wavelet coherence analysis (WCA). Top left: example of phase coherence between two sinusoidal signals (in blue and red), from in-phase (on the left) to antiphase (on the right) condition during a defined set of acquisition time; bottom left: scalogram that outputs from WCA for the two sinusoidal signals. X-axis indicates the progression of time (which may be expressed in seconds, minutes or number of volumes if referred to MRI scans), y-axis the scale (in Fourier periods). The map threshold is set at 95% confidence by a thick black curve based on Monte Carlo tests. Regions outside the cone of influence appear in faded colour. Color scale reflects the statistical significance of the wavelet coherence between the two signals. The phase angle between ROI time series at a particular location in the time–frequency plane is indicated by an arrow. Bottom right: legend for the interpretation of the direction of the arrows (phase arrows). Phase arrows pointing: right—signals are in phase; left—signals are in antiphase; down—blue signal leading red signal by 90°; up—blues signal lagging red signal by 90°.

