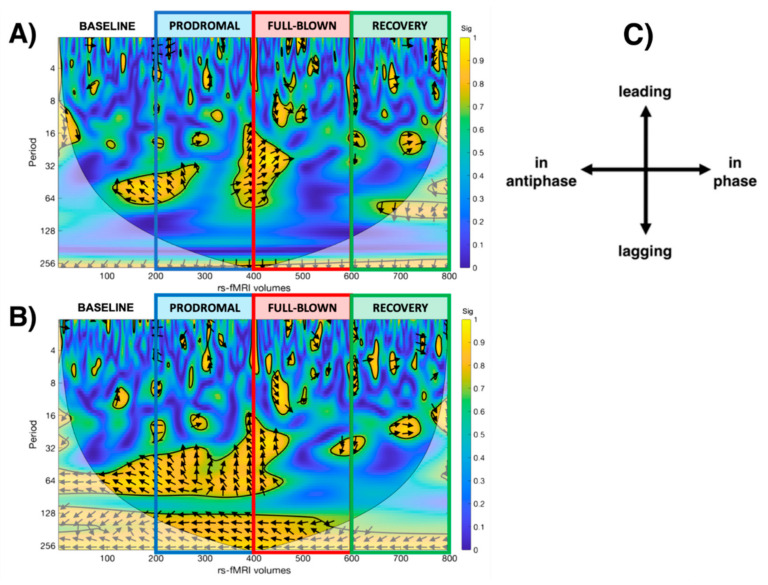
Figure 4.
Scalogram representing the statistically significant WCA analysis results showing the dynamic correlation with the salience network during each phase of the study (baseline, prodromal, full-blown, recovery), considering the (A) left thalamus and the (B) right thalamus as a seed. (C) legend for the interpretation of the direction of the arrows (phase arrows).

