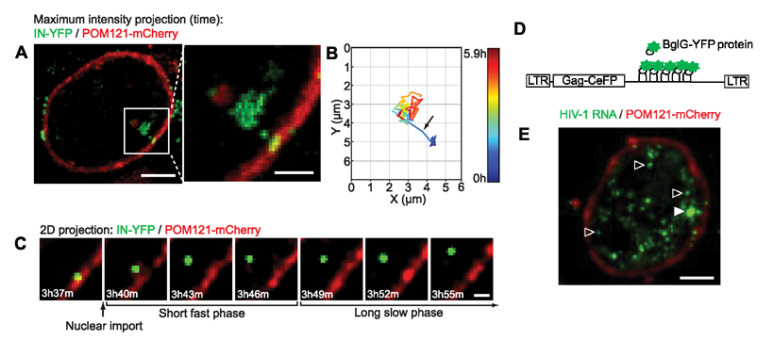
Figure 5.
Monitoring of HIV-1 in the nucleus. (A) 2D projection of the 3D tracking of an IN-YFP labeled HIV-1 complex in HeLa cells expressing POM121-mCherry as an NPC marker. After a long initial docking at the nuclear envelope, the complex enters the nucleus. Scale bar: 5 μm. (B) Trajectory of the imaged particle (C) Representative images of nuclear entry followed by a phase of rapid movements and a second phase of reduced mobility. Scale bars: 2 μm. (D) Schematic of the method of HIV-1 pseudogenome labeling (E) Confocal image of the sites of BglG-YFP accumulation in the nucleus of an infected HeLa cell. The black arrows show the viral RNA and the white arrow shows the transcription site. Scale bar: 5 µm. (Reproduced with permission from the Ref. [12] Copyright 2017, PLOS).

