Figure 3.
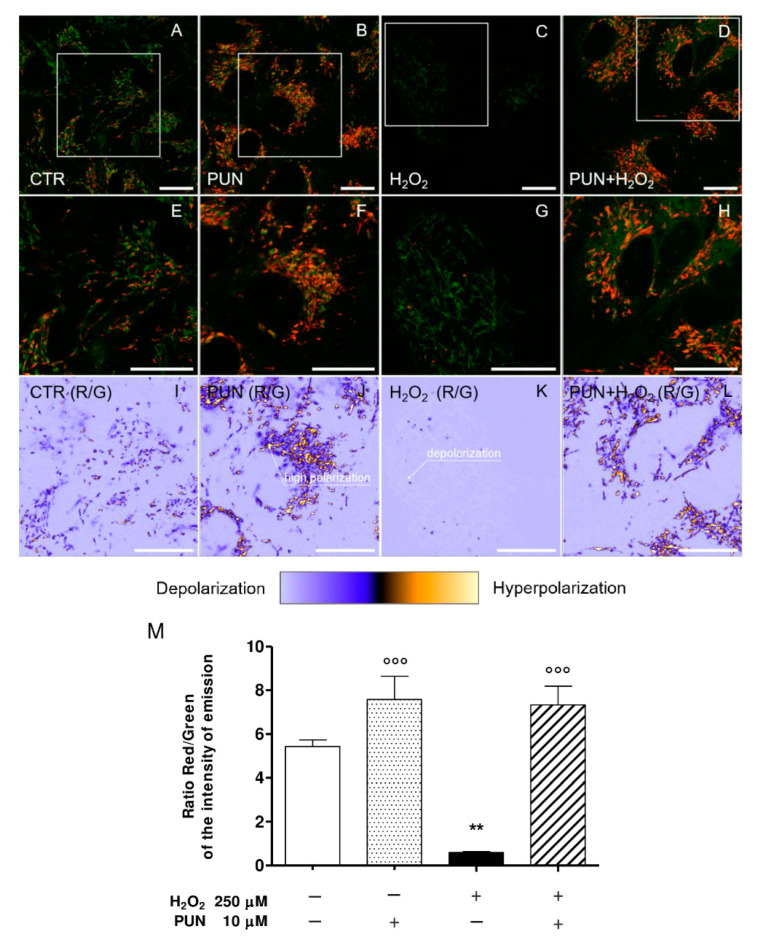
Representative confocal images of ARPE–19 cells untreated (CTR, first column), treated with 10 µM punicalagin (PUN, second column), treated with 250 µM hydrogen peroxide (H2O2, third column), or pre–treated with punicalagin 24 h before H2O2 (PUN+ H2O2, fourth column). Composite dual–channel images (A–D) are shown in the first row, along with a magnification of CTR (E), PUN (F), H2O2 (G), and PUN+ H2O2 (H), respectively. The green channel (emission: 525/50 nm) indicates the fluorescence intensity from monomers, while the red channel (emission: 595/50 nm) represents the emissions from aggregates. In the third row, representative maps of the red/green fluorescence intensity ratio (indicated as R/G) are reported for CTR (I), PUN (J), H2O2 (K), and PUN+ H2O2 (L), respectively. Each pixel’s color spans from light purple (low R/G emission intensity ratio, mitochondrial depolarization) to yellow (high R/G emission intensity ratio, mitochondrial hyperpolarization). Values of the emission intensity ratio range from 0 to 15. The means ± 1 SEM of the ratio are summarized in the bar plot reported in (M). Results are from two independent experiments, each including three replicates per experimental group. One–way ANOVA analysis was carried out followed by post hoc Newman–Keuls test. ** = p < 0.01 vs. control; °°° = p < 0.001 vs. 250 µM H2O2 alone.

