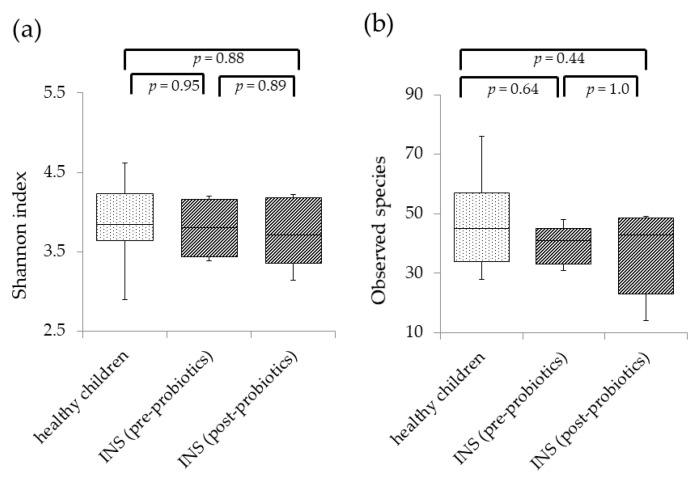
Figure 1.
Analysis of the diversity of gut microbiota in healthy children and children with idiopathic nephrotic syndrome (INS) before and after Clostridium butyricum MIYAIRI administration. A whisker-plot diagram of Shannon index (a) and number of observed species (b) is shown for each group. Shannon index and the number of observed species were calculated in healthy children as well as children with INS before and after probiotic treatment. There were no significant differences among the three groups in either Shannon index or number of observed species. The central horizontal line in the box represents the median value, while the bottom and top edges of the box represent the first and third quartiles, respectively. Central vertical lines extend from the box to the 90th and 10th percentiles.

