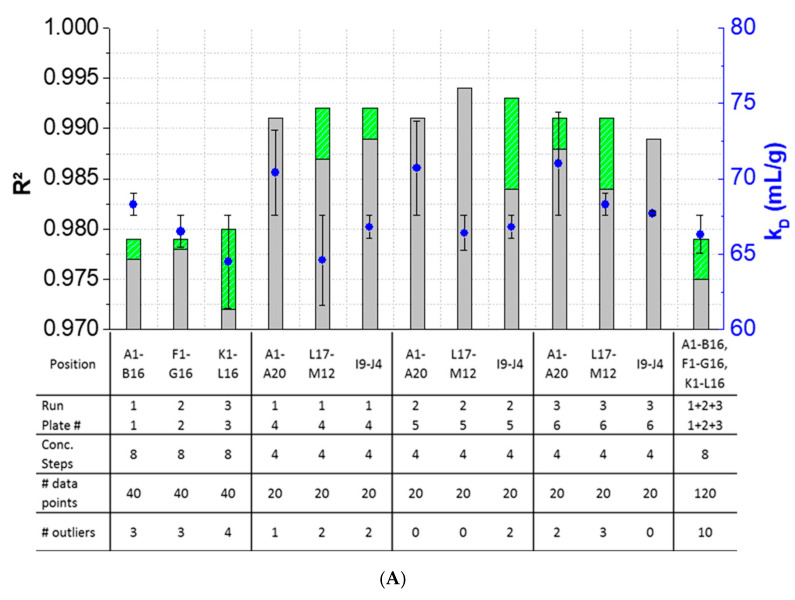
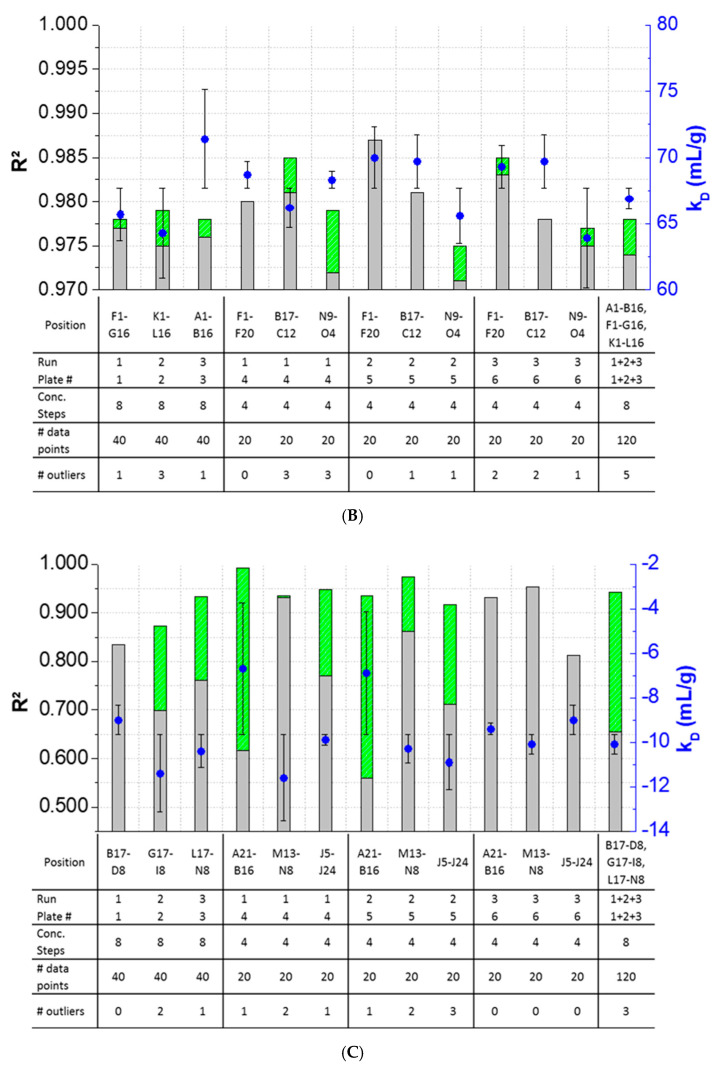
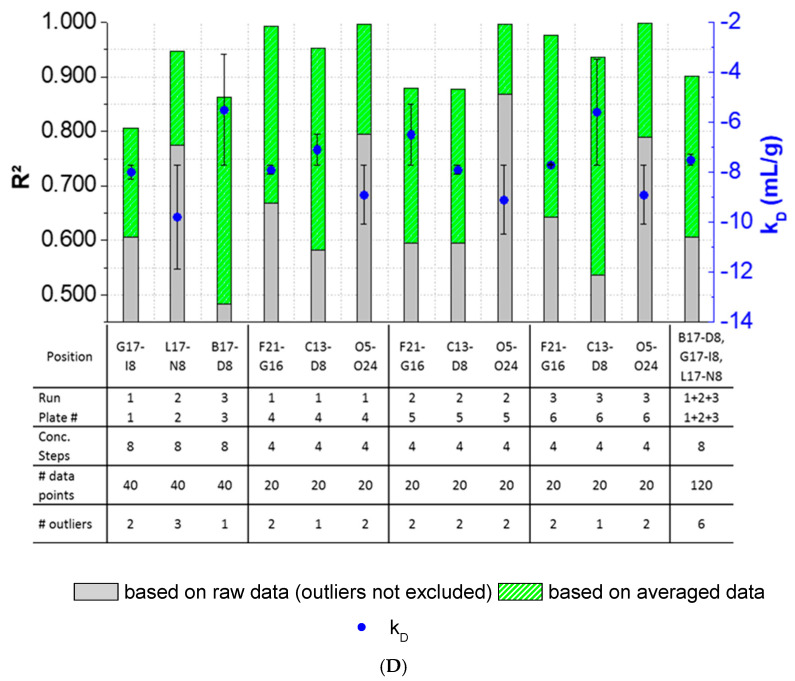
Figure 4.
Variations of the coefficients of correlation (R2) as a function of the excluded outliers and number of data points for: positive kD: (A) LysSig2243 and (B) LysSig5161 and negative kD: (C) LysSig2243+NaCl and (D) LysSig5161+NaCl. An increase of R2 (based on the excluded outliers) is indicated by stacked green bars. The table contains the plate position, run, and plate number according to Figure 1; Figure 2; number of concentration steps (2, 5, 10, and 14-mg/mL or 2, 3.5, 5, 7, 8, 10, 12, and 14-mg/mL Lysozyme); used data points for the kD analysis; and number of detected outliers by the Grubbs’ test. Corresponding kD values are shown as blue spheres on the secondary y-axis. Error bars represent the deviation compared to the overall average kD collected for all runs and plates.


