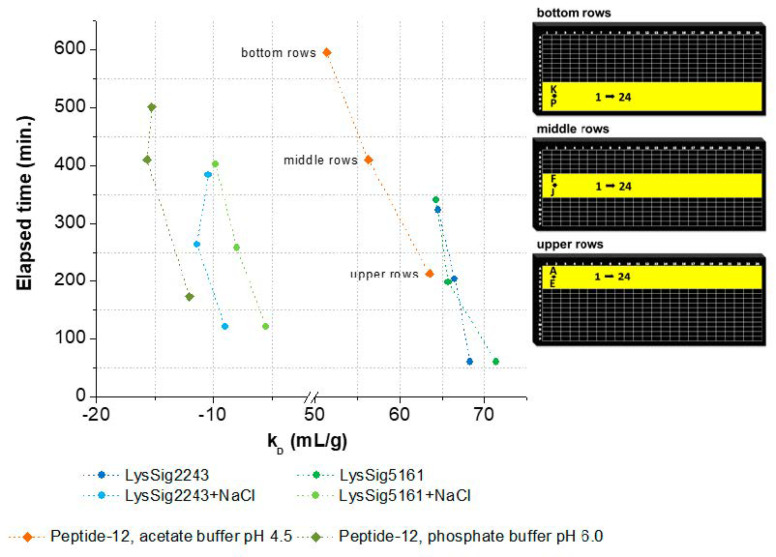
Figure 5.
kD as a function of elapsed time and the corresponding plate positions (bottom, middle, and upper rows). Spheres present kD collected for lysozyme, and squares show kD collected for peptide-12 in acetate, pH 4.5 (orange), or phosphate, pH 6.0 (olive green), buffer. kD was calculated using the wells as highlighted in yellow on the right-hand side. Exact well numbers can be found in Appendix B.

