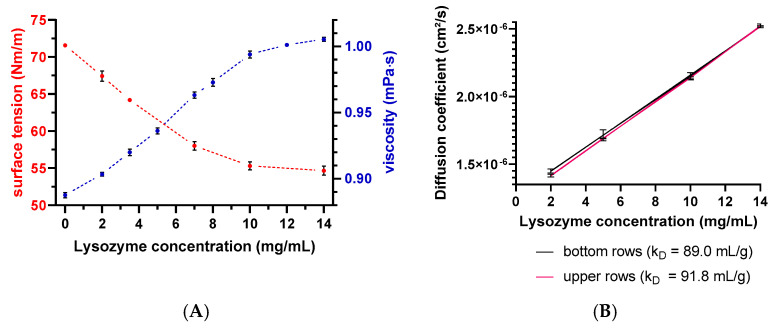
Figure 6.
(A) Surface tension and dynamic viscosity data as a function of the lysozyme concentration. Red spheres present the surface tension determined by the Wilhelmy plate method, and viscosity data are shown as blue spheres on the secondary y-axis. Error bars represent the standard deviation of 4 measurements. Error bars are possibly smaller than the symbols. (B) Diffusion coefficient as a function of the lysozyme concentration and plate position. The red line represents D collected in upper rows, and the black line represents D collected in the bottom rows. Error bars represent the standard deviations of 6 measurements for the diffusion coefficients by DLS.

