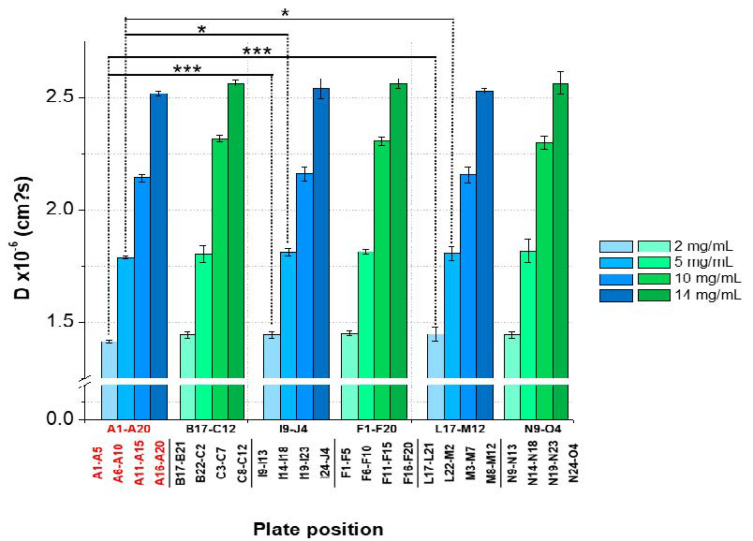
Figure 7.
Statistical evaluation (intra-plate coefficient of variation (CV)) with regard to the diffusion coefficients as a function of plate position collected for two lysozyme batches (LysSig2243: blue and LysSig5161: green); 4 concentrations (2, 5, 10, and 14-mg/mL lysozyme); and 5 replicates. Edge rows (A1–A20) are marked in red. The plate design is shown in Figure 1. Significant differences are indicated by asterisks: * p < 0.05 and *** p < 0.001.

