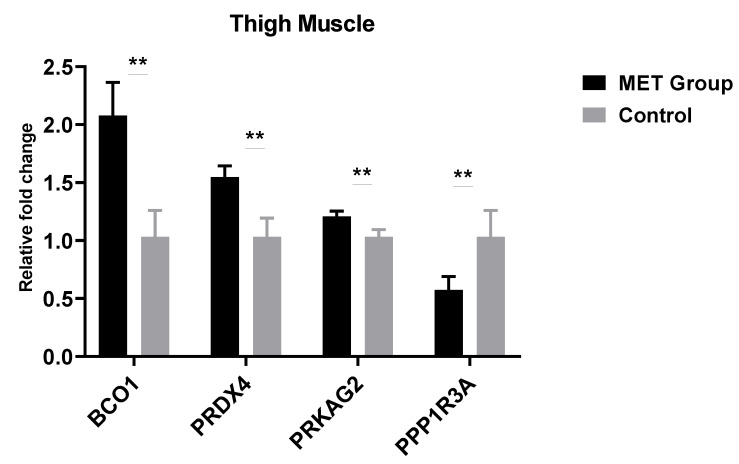
Figure 2.
Thigh muscle relative fold change (gene expression) of male progeny with paternal dietary Met. Control group (0.28% Met), Methionine group (0.38% Met as 0.28% Met + 0.1% coated Met). The data are expressed as mean ± SEM and n = 12. Significance (**: p < 0.01). BCO1, beta-carotene oxygenase 1; PRDX4, peroxiredoxin 4; PRKAG2, protein kinase AMP-activated non-catalytic subunit gamma 2; PPP1R3A, protein phosphatase 1 regulatory subunit 3A.

