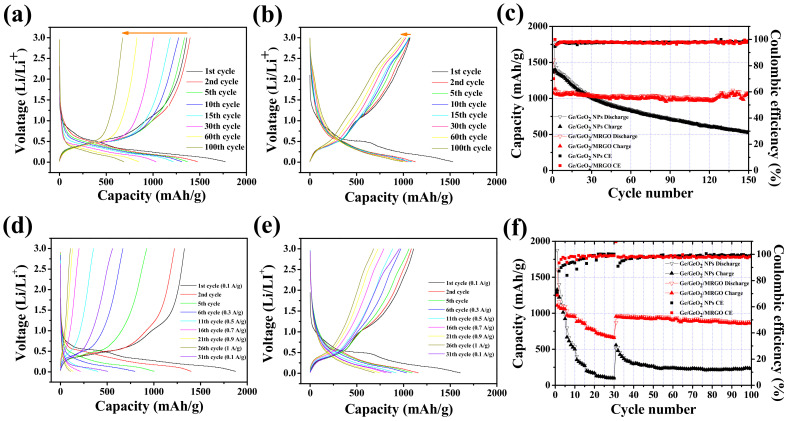
Figure 10.
Charge/discharge curves of (a) Ge/GeO2 NPs and (b) Ge/GeO2/MRGO (at a current density of 100 mA/g), and (c) their cycling performances. Charge/discharge curves of (d) Ge/GeO2 NPs and (e) Ge/GeO2/MRGO at current densities of 100, 300, 500, 700, 900, and 1000 mA/g for 5 successive cycles (after 30 cycles the current density was reverted back to 100 mA/g), and (f) their cycling performance and rate capability.

