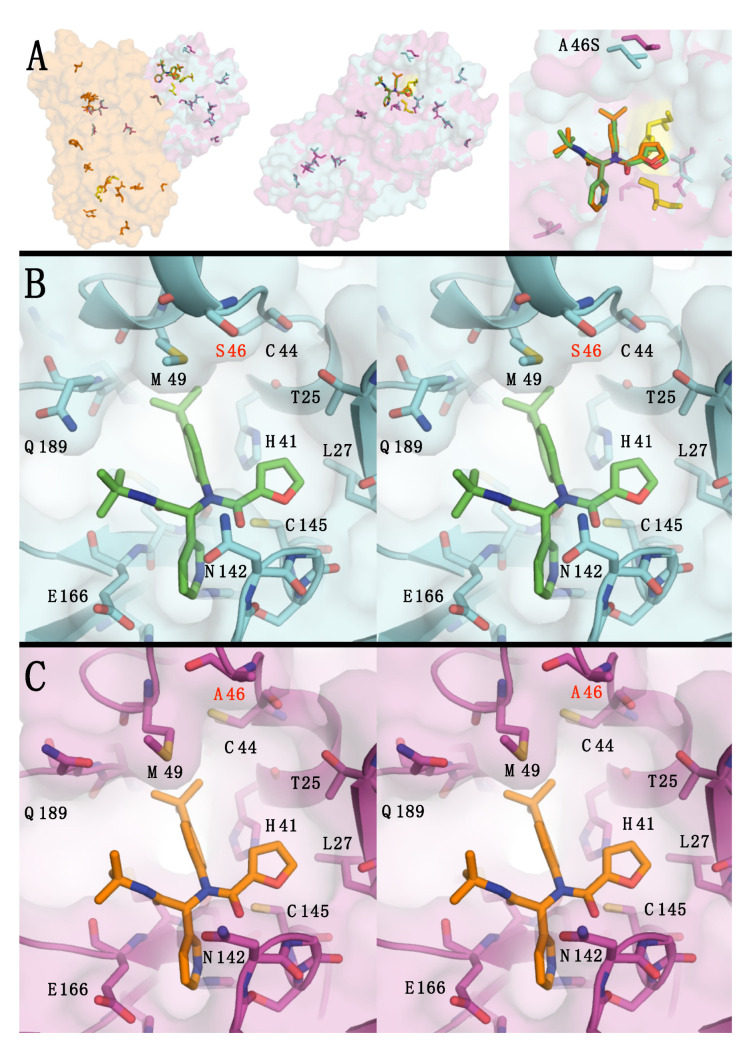
Figure 3.
(A) The twelve amino acid differences between SARS2 and SARS1-Mpro shown as a dimer, single subunit, and active site. SARS2 (in cyan) and SARS1 (in magenta) are shown with transparent surfaces and amino acid differences shown as sticks. The dimer subunits (in orange) and the catalytic residues (in yellow) are included. (B) Stereo pair of SARS2-Mpro-ML188 complex active site. (C) Stereo pair of SARS1-Mpro-ML188 complex active site.

