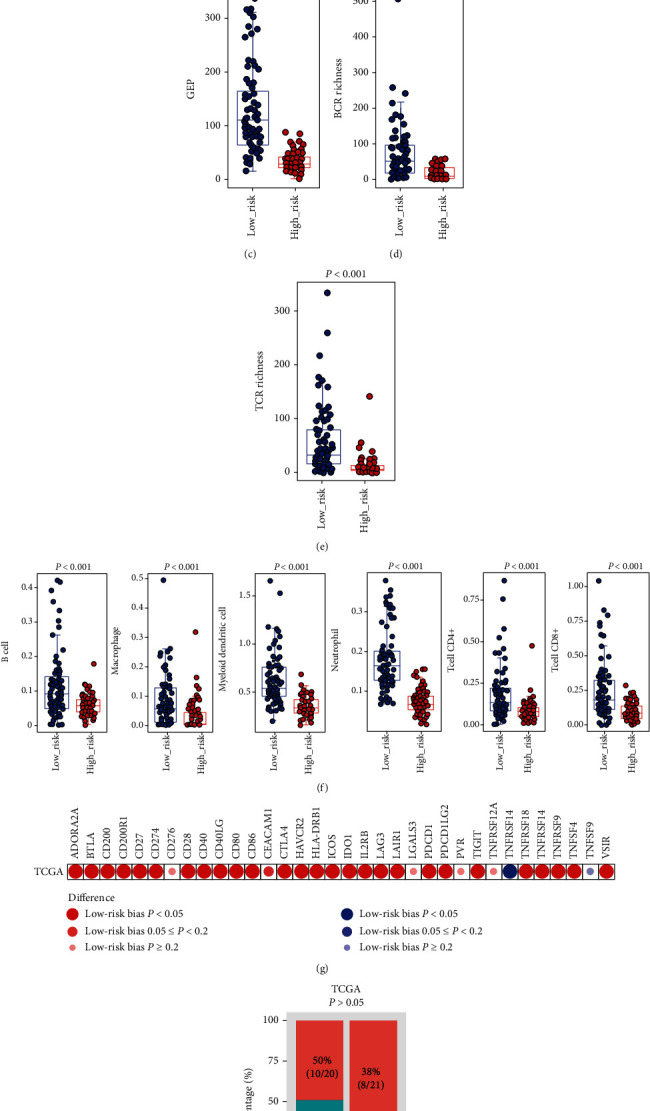
Figure 5.

The relationship between the IAG signature and immunotherapy-related biomarkers. (a) The propensity score between the high-risk and low-risk groups. (b) CYT, (c) GEP, (d) BCR richness, and (e) TCR richness. (f) Six immune cell populations, including B cell, macrophage, myeloid dendritic cell, neutrophil, T cell CD4+, and T cell CD8+ between the high- and low-risk groups. (g) Differences in the mRNA expression level of 34 immune checkpoints. (h) Comparison of immunotherapy response rate between the high- and low-risk groups.
