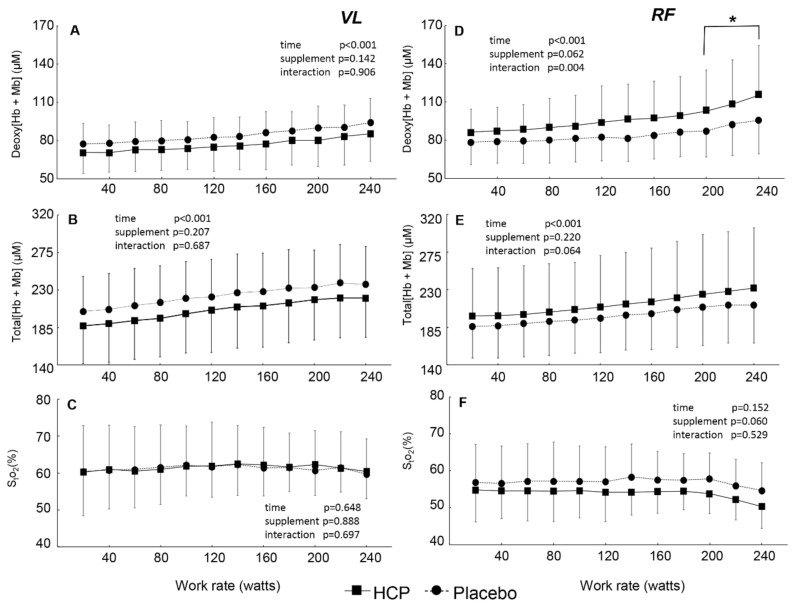
Figure 3.
Group mean values for the vastus lateralis (VL) muscle deoxygenated hemoglobin and myoglobin concentration (deoxy[Hb + Mb]) (A), total hemoglobin and myoglobin concentration (total[Hb + Mb]) (B), tissue O2 saturation (StO2) (C), and rectus femoris (RF) muscle deoxy[Hb + Mb] (D), total[Hb + Mb] (E), and StO2 (F) versus the power output during cycle exercise in the HCP and placebo groups. Error bars: SD. Significant difference between HCP and placebo at higher work rates; * p < 0.05.

