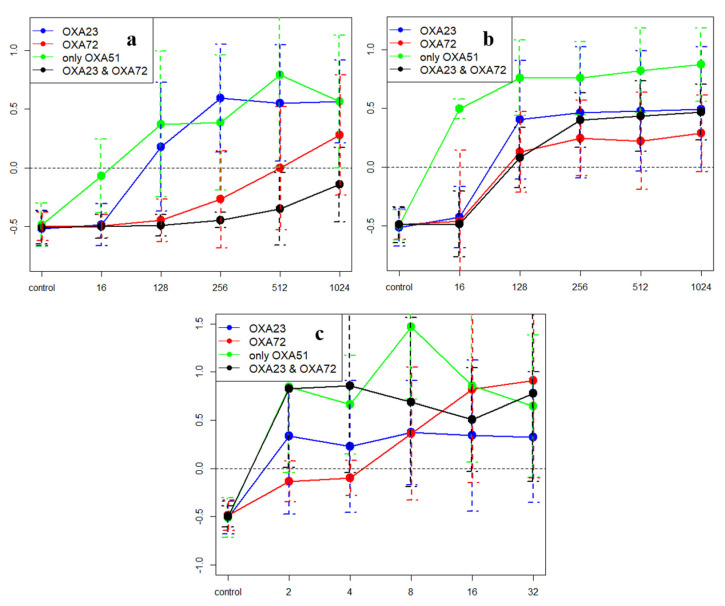
Figure 3.
Result of the time-kill assays, X axis shows the drug concentration, Y axis shows the mean k-values. Values above 0 (dashed line) indicate killing effect (see text for details). (a) Summary of the results of the time-kill assays against meropenem. (b) Summary of the results of the time-kill assay against imipenem. (c) Summary of the results of the time-kill assay against colistin.

