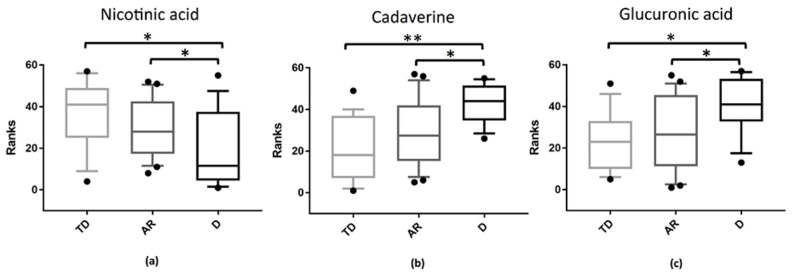
Figure 5.
Statistically significant metabolites in the comparison among different PD phenotypes groups: Tremor Dominant (TD); Akinetic Rigid (AR); Dyskinetic (D). Corrected p values were evaluated using Mann–Whitney U test followed by Holm–Bonferroni correction test. The metabolites found, (a) nicotinic acid, (b) cadaverine, (c) glucuronic acid, are displayed and expressed in the graphs y axis as ranks (data transformation in which numerical or ordinal values are substituted by their rank once the data are sorted). (*): p < 0.05; (**): p < 0.01.

