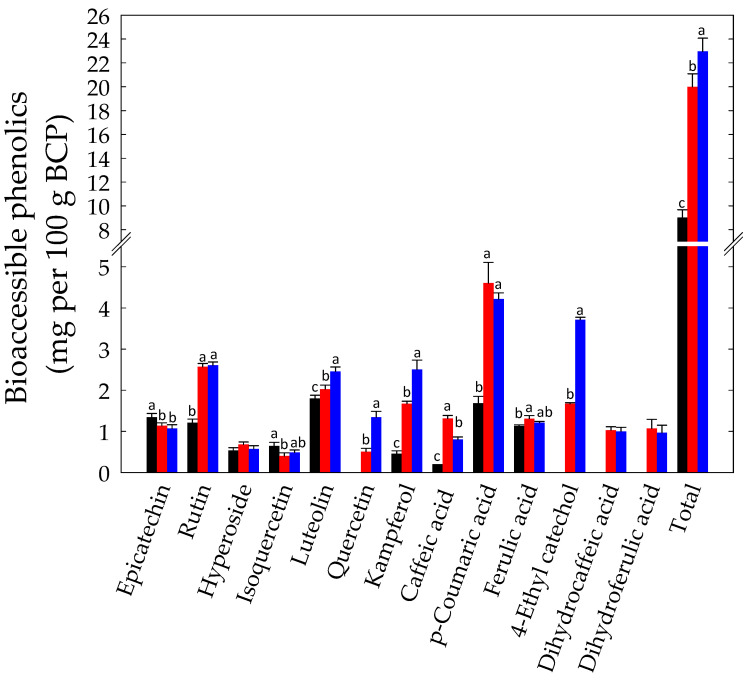
Figure 7.
Bioaccessible phenolic compounds (mg per 100 g BCP) identified in Raw- (black bars), Unstarted- (blue bars), and Started-BCP (red bars). Total phenolics were calculated as the sum of individual compounds as detected by HPLC/UHPLC-ESI-MS/MS. Data are the means (± SD) of three independent experiments analyzed in triplicate. Data were subjected to one-way ANOVA; pair-comparison of treatment means was achieved by Tukey’s procedure at p < 0.05. For each compound, bars with different superscript letters differ significantly (p < 0.05).

