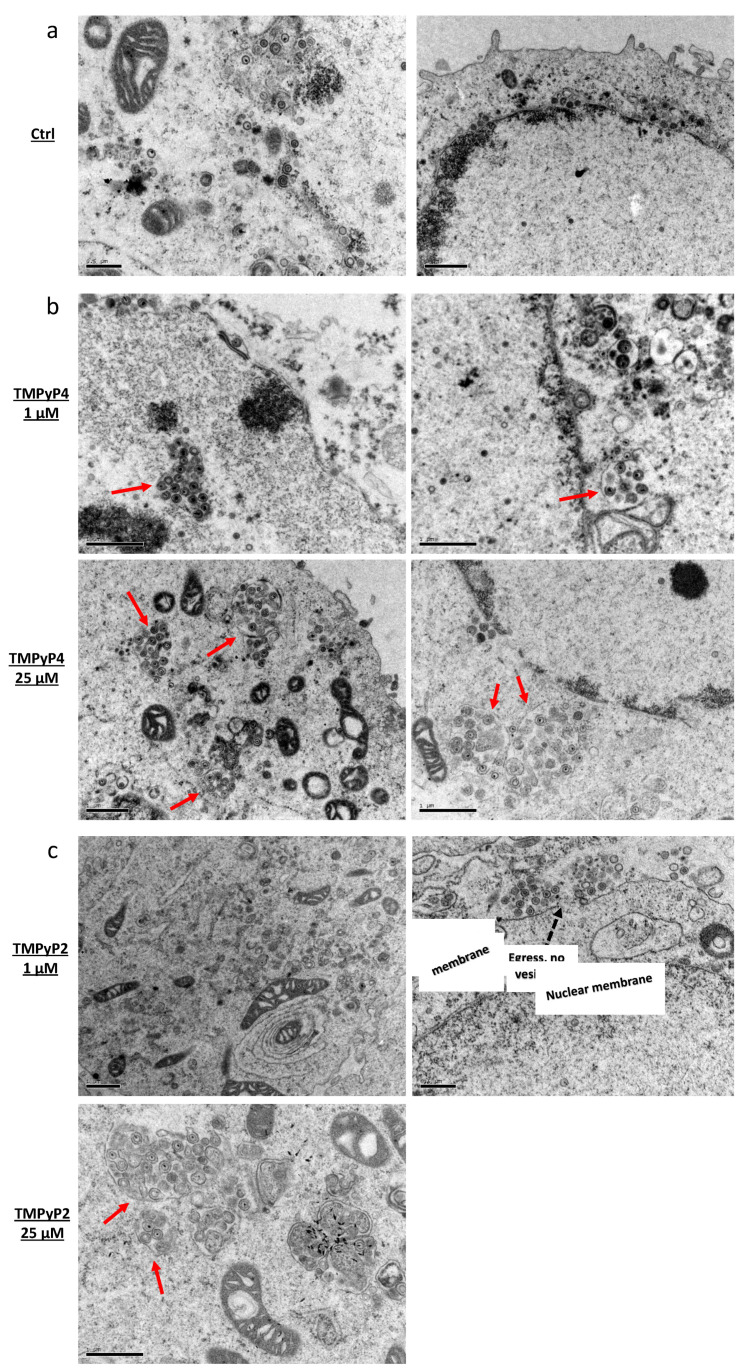
Figure 8.
Transmission electron microscopy analysis of HSV-1 infected cells at a MOI of 1, in the absence or presence of TMPyP4 or TMPyP2. Panels display: (a) non-treated infected Vero cells; (b) infected cells treated with TMPyP4 at 1 µM (top) or 25 µM (bottom); (c) infected cells treated with TMPyP2 at 1 µM (top) or 25 µM (bottom). In the cytoplasm of infected/treated cells HSV-1-containing vesicles are highlighted with solid red arrows. Dashed black arrows indicate viral egress from the cytoplasmatic membrane. Black bars at the bottom left corner of each figure indicate the image scale.

