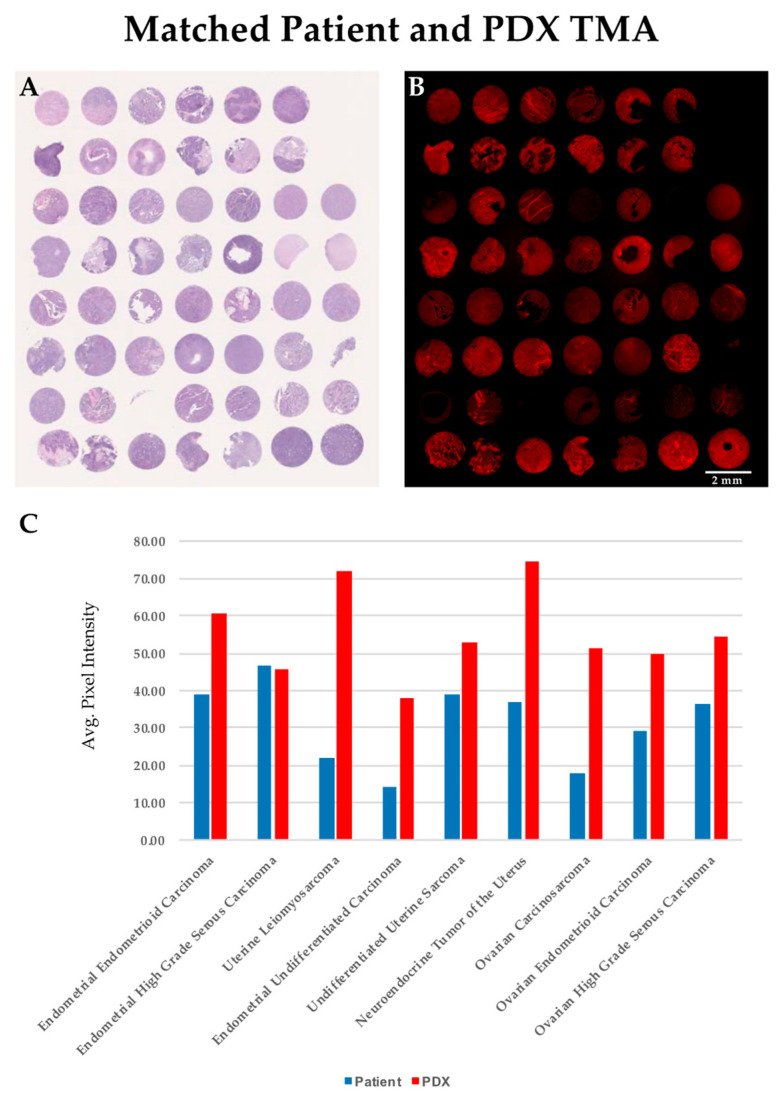
Figure 2.
Comparison of SBK4-TR staining of matched PDX and patient samples indicates a high level of SBK4-TR labeling for all cancer tissues. Average staining data are shown in panel (C). Comparison of adjacent PDX/patient matched tissue microarrays (TMAs) stained for hematoxylin and eosin (A), and SBK4-TR (B), indicate the high level of overall staining. Scale bar = 2 mm. We calculated the average SBK4-TR staining of patient normal, patient tumor and PDX samples for nine tumor types that had both patient and matched PDX tumor tissue (C). Plotting of the average values obtained for the tissue biopsy cores for the patient and PDX tumors illustrates the overall high level of staining intensity of patient and matched PDX samples (C).

