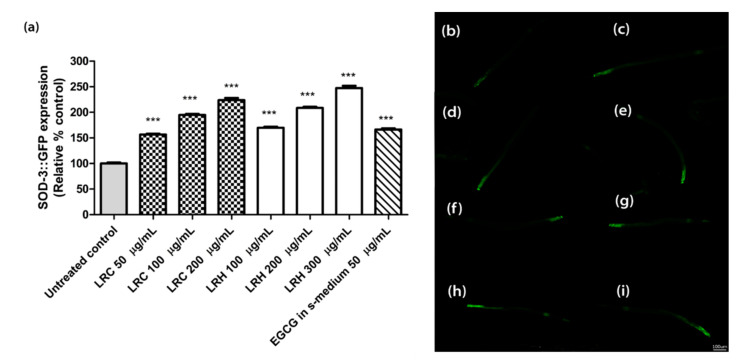
Figure 10.
The effect of different concentrations of LRC and LRH extracts and EGCG on SOD-3 expression in CF1553. (a) Relative fluorescence; 20 µM control was set to 100%. (b–i) The fluorescence images of worms: (b) control; (c–e) worms treated with LRC at 50, 100, and 200 µg/mL; (f–h) worms treated with LRH at 100, 200, and 300 µg/mL (i) EGCG-treated worms. Values are the mean ± SEM of at least three independent runs. *** p < 0.001 vs. control.

