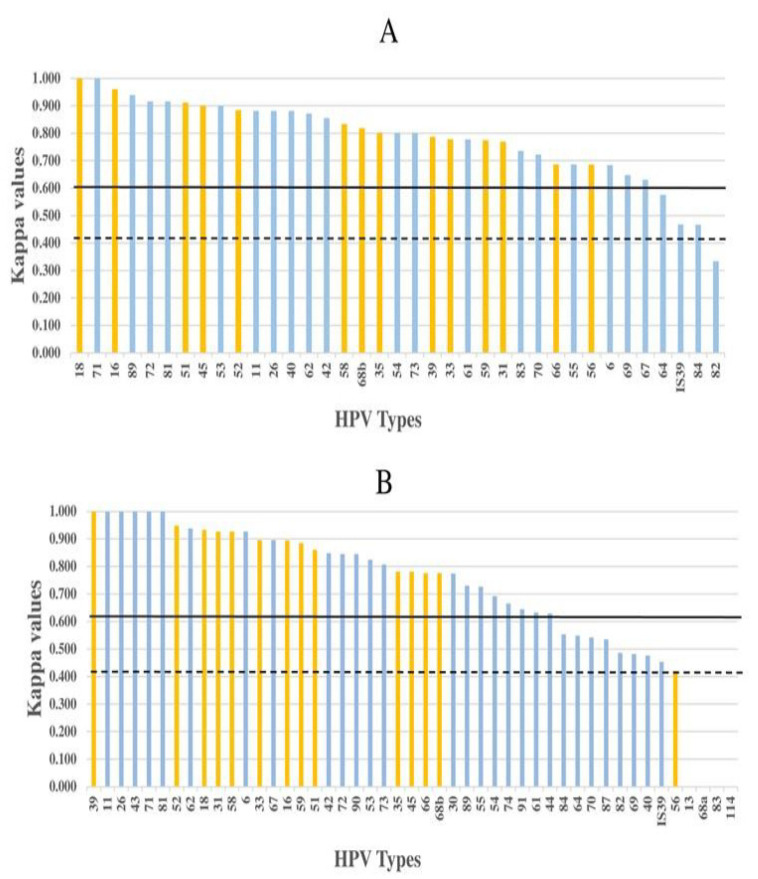
Figure 2.
Individual HPV type-specific agreement as indicated by kappa values between PCR-15 and LA for 37 types (A), and between PCR-15 and TypeSeq for 47 types (B). HPV types are shown on the X-axis (yellow bars: HR types and others: LR types) and corresponding kappa values on the Y-axis. HPV types with kappa values crossing the black line represent >substantial agreement (k ≥ 0.61) between tests, whereas HPV types that fall between the black line and dashed black line represent moderate (k = 0.41–0.6) agreement between tests.

