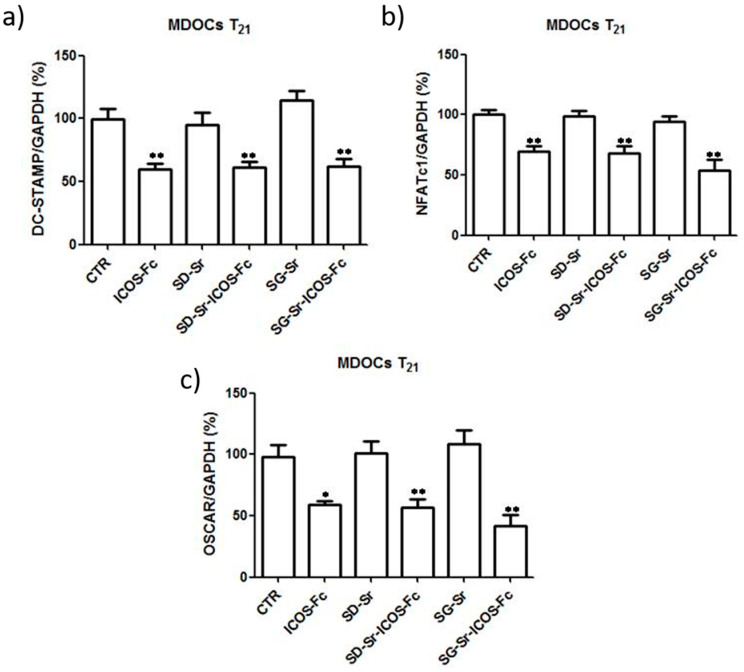
Figure 16.
Effect of MBGs reagents on MDOC expression of DC-STAMP, NFATc1, and OSCAR. Bar graphs show the real-time PCR data of expression of (a) DC-STAMP, (b) NFATc1, and (c) DC-STAMP at T21. Data are expressed as the mean ± SEM. The data are normalized for the expression in the control cells (control expression set at 100%). * p < 0.05, ** p < 0.01 versus the control (Dunnett’s test).

