
Figure 6.
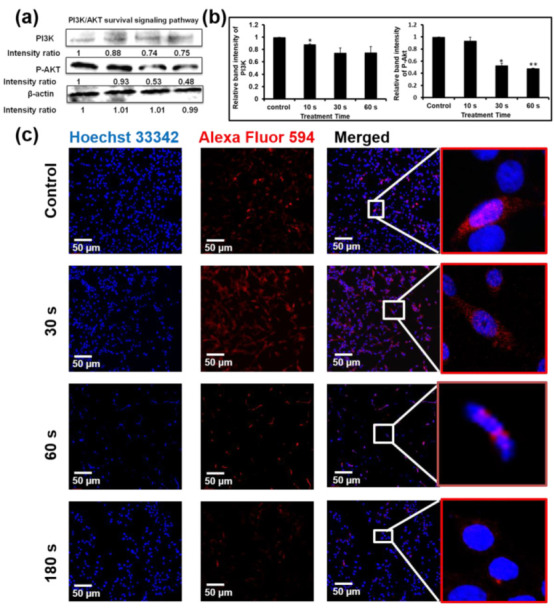
(a) Levels of PI3K and p-Akt were determined by Western blotting. (b) Bar graph representing the expression levels of PI3K and p-Akt. (c) Immunofluorescence-based visualization of p-Akt expression. Red: Fluorescence signal indicating marker expression. Blue: Nuclei visualized by Hoechst 33,342 dye. Confocal microscopy. 10× magnification. Scale bar = 100 µm. Data are presented as means ± SD of three independent sets of experiments. * p < 0.05, ** p < 0.01.