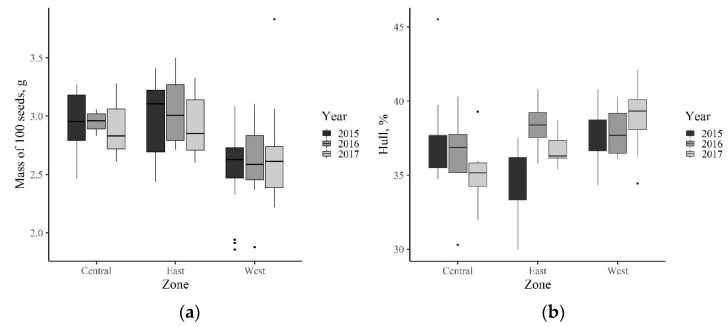
Figure 2.
(a) Mass of 100 seeds and (b) hull percentage of seeds collected in populations located in different climatic zones in Latvia, in 2015–2017. Each box shows the interquantile range (25–75 percentile), the bars show the distance between the smallest and the largest point in the 1.5 times interquantile range, the dots are data points beyond this range.

