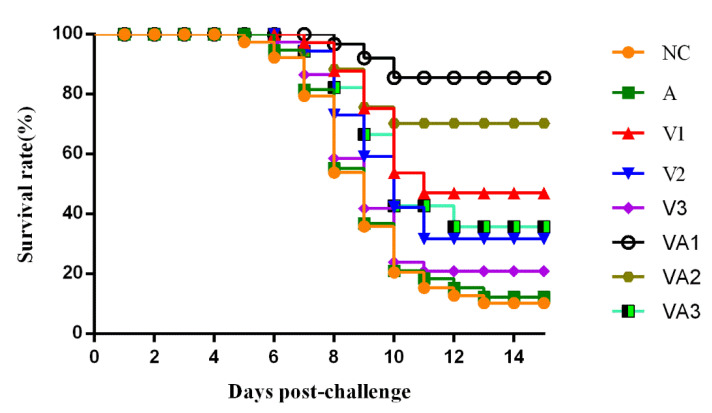
Figure 5.
Cumulative survival rate of tilapia after challenge with 106 50% tissue culture infectious dose (TCID50) TiLV: The survival rate of fish was analyzed using the Kaplan–Meier survival curve using the log-rank test. One representative of three similar independent experiments is shown (n = 30). See Figure 1 for the experimental group abbreviations.

