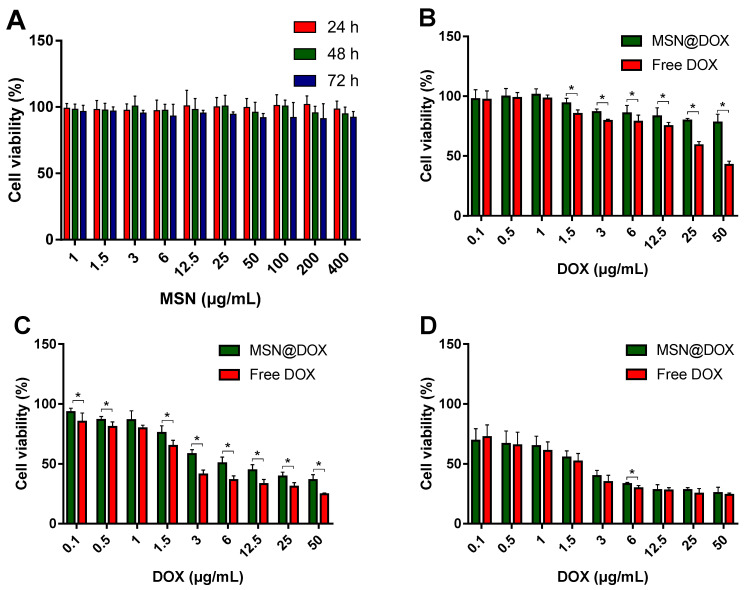
Figure 6.
Cell viability of MCF-7 cells exposed to different concentration of MSNs, MSN@DOX, and free DOX. (A) MSNs; (B) after 24 h of MSN@DOX and free DOX; (C) 48 h of MSN@DOX and free DOX; (D) 72 h MSN@DOX and free DOX. Values are expressed as means ± SD (n = 5). * p < 0.05 compared with the free DOX group.

