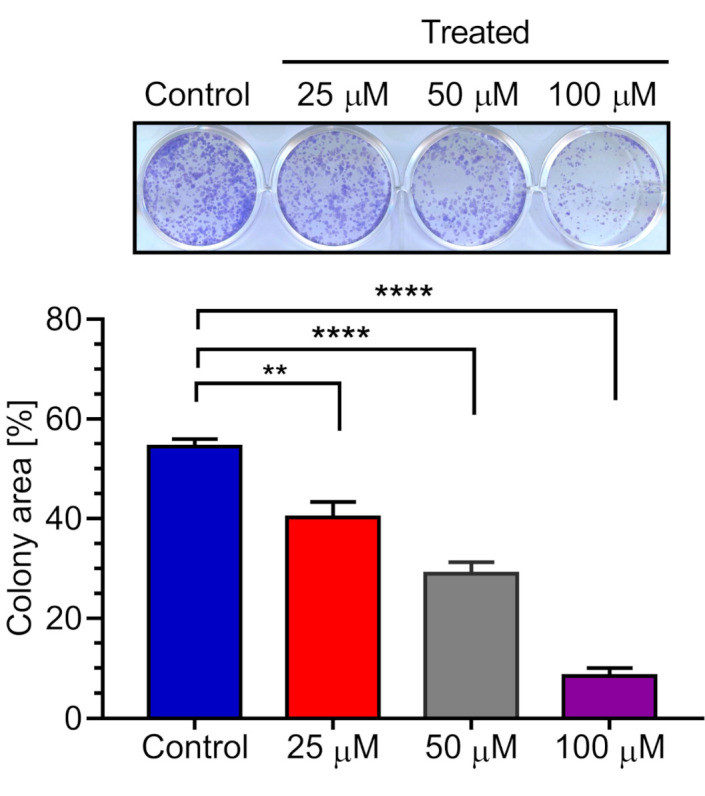
Figure 8.

Effect of 5-hydroxy-7-methoxyflavone (3) on colony formation by PANC-1 cells. Representative wells showing PANC-1 cell colonies. Graph showing mean values of the area occupied by PANC-1 cell colonies (three replications). Statistical analysis was carried out with students t-test (see Figure S12). **** p < 0.0001, ** p < 0.01 when compared with the untreated control group.
