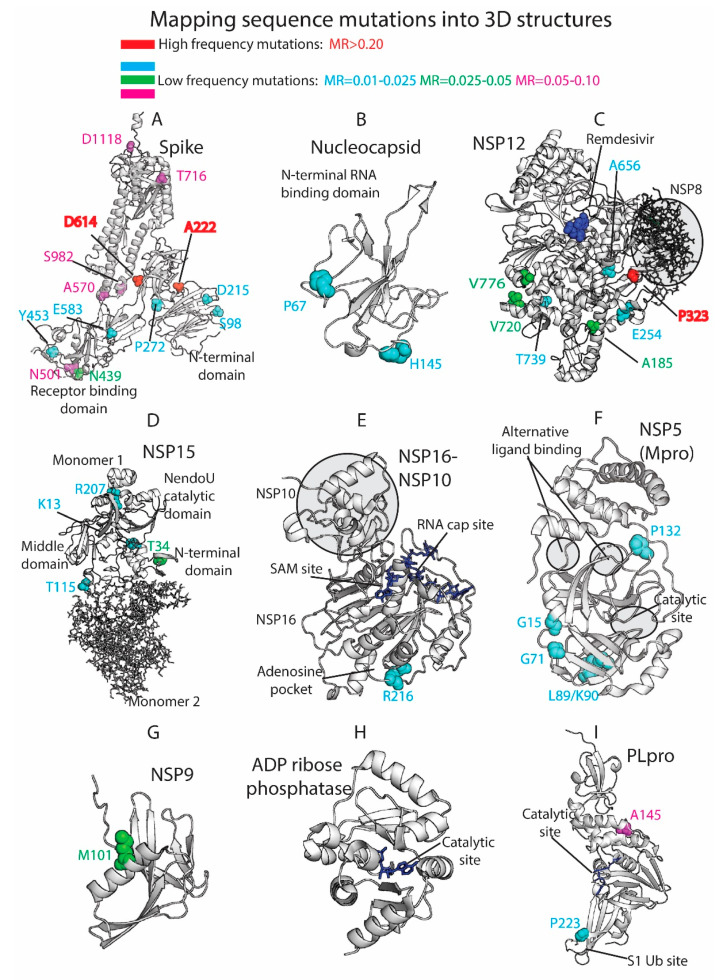
Figure 4.
Three-dimensional (3D) protein structures colored by residue mutation rates: Spike, Nucleocapsid, RdRp (NSP12), Endoribonuclease (NSP15), NSP16-NSP10 heterodimer, Mpro (NSP5), NSP9, ADP ribose phosphatase (NSP3), and Papain-like protease (PLpro, NSP3). Proteins represented in white ribbons (MRs < 0.01) and color-coded residues (cyan: MRs = 0.01–0.025, green: MRs = 0.025–0.05, magenta: MRs = 0.05–0.10, red: MRs > 0.20. No residues with MR values between 0.10 and 0.20 were available in the shown crystallized structures).

