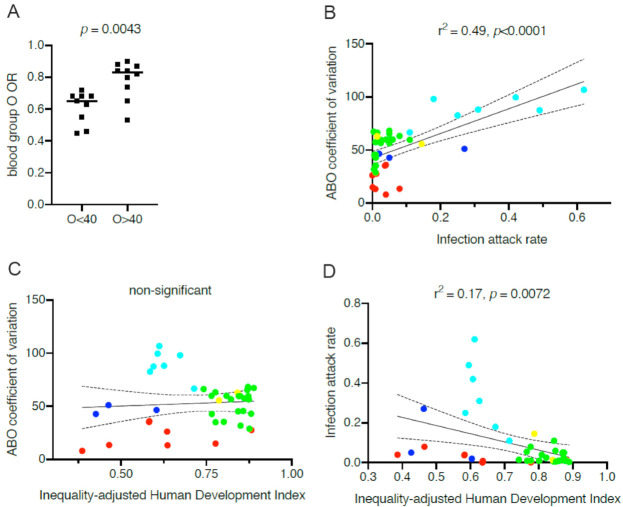
Figure 2.
Relationship between ABO blood groups and the impact of COVID-19 across countries. (A) Blood group O odd ratios (ORs) of COVID-19 relative to the other blood groups and blood group O frequencies at various geographical locations. Odd ratios were obtained from the works in [1,2,3,6,9,10,11,14,17,18,19,22,24], and the frequencies of blood group O were those reported in the groups of controls of the corresponding studies, representing frequencies in the local populations. OR values in populations where frequencies of blood group O are below and above 40% (O < 0.4 and O > 0.4, respectively) were compared by a two-tailed Mann–Whitney test. (B) Regression analysis between coefficient of variation calculated from the distribution of ABO for each country and attack rates represented by median estimates calculated by O’Driscoll et al. [95] from seroprevalence studies. (C) Regression analysis between ABO coefficients of variation of each country and the 2018 IHDI (inequality-adjusted human development index) obtained from the UNDP (United Nation Development Program). (D) Regression analysis between COVID-19 attack rates of each country and the 2018 IHDI. Countries are labeled by geographic area. Cyan: Central and South Americas; blue: Africa; green: Europe; yellow: North America; red: Asia.

