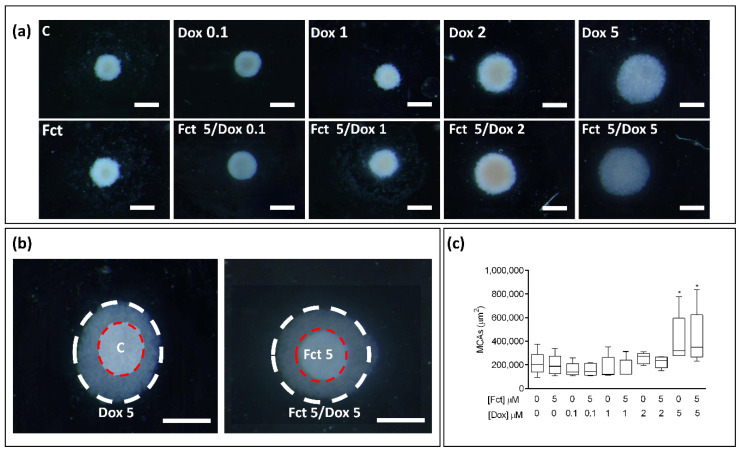
Figure 11.
Representative stereomicroscopic images of 3D cultures-MCAs in the tested conditions of fucosterol (Fct) at 5 µM alone, and in combination with doxorubicin (Dox) at 0.1, 1, 2, and 5 µM. Cells treated with 0.1% DMSO (C) and Dox (5 µM) were included as negative and positive controls, respectively (a). Two images of MCAs from C and Fct (5 µM) (red dashed circle) and Dox (5 µM) and Fct (5 µM) + Dox (5 µM) (white dashed circle) are overlapped to show the difference in cellular aggregation between the two tested conditions (b). Box and whisker graph of Areas of MCAs expressed as median, maximum, minimum, and interquartile range (Q3-Q1 of five independent experiments (16 MCAs/per tested condition/per experiment) (c). Significant differences: * p < 0.05. Scale bar: 500 µm.

