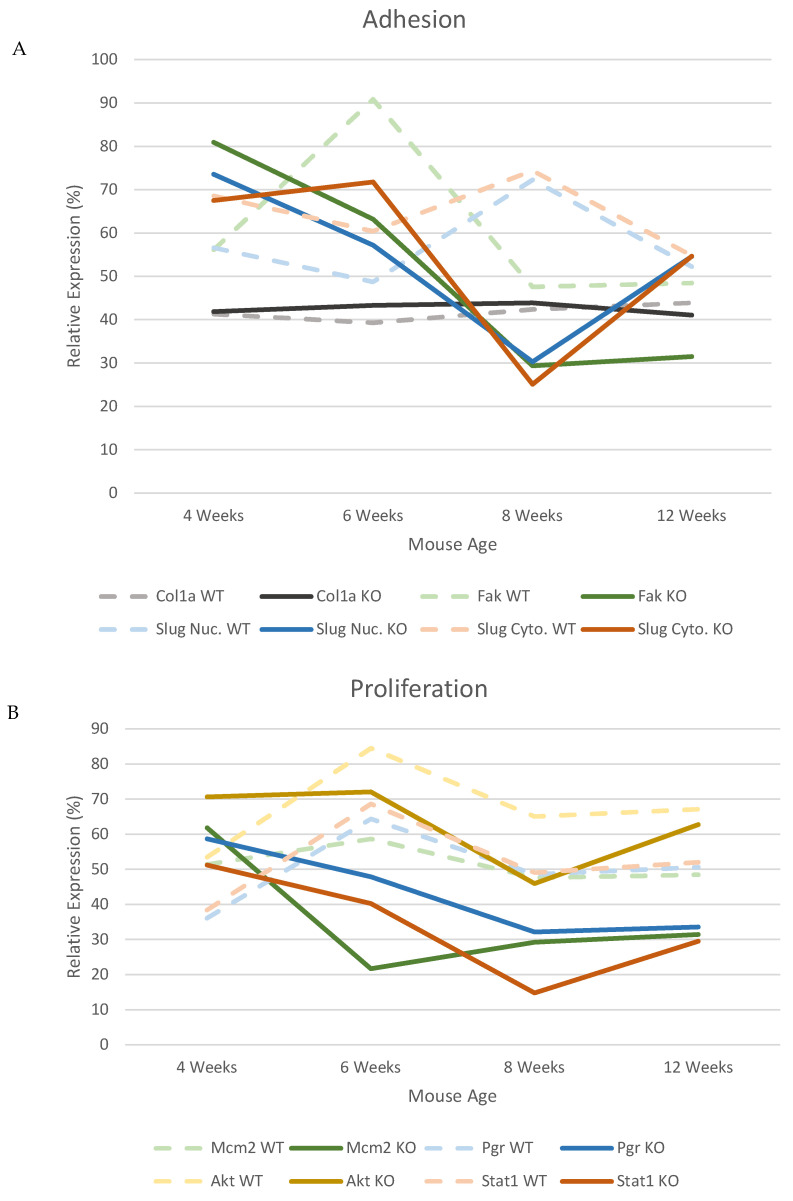
Figure 8.
The expression patterns of the proteins analysed show alternative peaks of expression in the Csmd1 KO mice compared to the WT. The expression levels across all time points (4–12 weeks) are shown to demonstrate how the specific expression of the proteins changes over puberty and also how the patterns vary between the WT and KO mice. (A) Graph showing the proteins associated with regulating cell adhesion. (B) Graph showing the proteins associated with regulating cell proliferation. In both graphs clear alternative peaks can be observed between the WT, peak of expression commonly at 6 weeks, and the KO mice, peak of expression commonly at 4 weeks.

