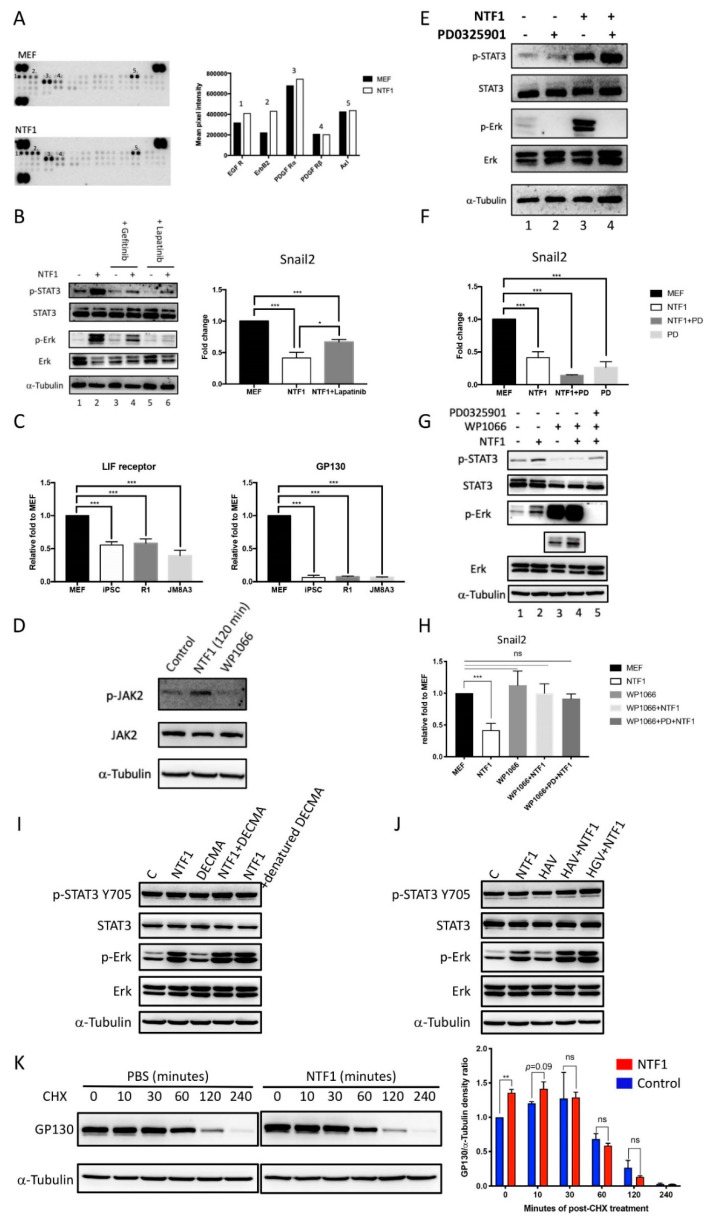
Figure 4.
NTF1 may stabilize the LIFR/gp130 complex to transduce the STAT3-mediated signal cascade (A) Use of a receptor tyrosine kinase array revealed the potential NTF1-interacting candidates on the MEFCol1a1 4F2A Oct4-GFP membrane. The numbers on the bar graph correspond to the numbers on the blot images. (B) Examination of the signals involved in the NTF1-mediated signal transduction pathways using Gefitinib and Lapatinib, which are specific inhibitors of EGFR and EGFR/ERbB2, respectively. Using the same treatments, the harvested total RNA of the treated cells was subjected to quantitative RT-PCR analysis with a Snail2-specific primer set. (C) A comparative RT-PCR analysis of LIFR and gp130 in MEFCol1a1 4F2A Oct4-GFP, iPSCCol1a1 4F2A Oct4-GFP, R1 ESC, and JM8A3 ESC cells. (D) Treatment with NTF1 also activates JAK2. MEFCol1a1 4F2A Oct4-GFP cells treated with NTF1 or WP1066 for 120 min were subjected to phosphorylation analysis of Jak2, and untreated MEFs served as the control. (E,F) A synergistic effect on repression of Snail2 expression was observed in the presence of both PD0325901 and NTF1. Using the same treatments, the counterpart experiment was subjected to quantitative RT-PCR analysis with a Snail2-specific primer set. (G,H) Inactivation of STAT3 abolishes the repression of Snail2 expression. MEFCol1a1 4F2A Oct4-GFP cells were subjected to 24-h serum starvation before treatment with NTF1, WP1066, NTF1+WP1066, or NTF1+WP1066+PD0325901. Both cell lysates and total RNA were extracted and subjected to western blotting and RT-PCR analyses, respectively. (I,J) The effect of the DECMA-1 antibody and HAV and HGV peptides in the NTF1-treated experiments. The working concentrations of DECMA-1 (ThermoFisher Scientific, Waltham, MA, USA; 14-3249-82) and the HAV and HGV peptides were 5 µg/mL, 5 mM, and 5 mM, respectively. (K) NTF1 stabilized gp130 in the first 10 min treatment. In the left panel, cycloheximide (CHX) was applied to MEF cells following treatment with NTF1 or PBS. A time-course experiment was performed to observe the change in the gp130 expression level at 0, 10, 30, 60, 120, and 240 min after applying the treatments. The working concentration of CHX was 50 mM. The right panel displays the quantitative result of western blot signals. All groups were normalized to the 0 min treatment in PBS. In each group, the normalized gp130 value was divided by the amount of α-tubulin. Bars represent the mean ratios of each group, and the experiment was performed in duplicate. “+” and “-” denote that the factor was present or absent in the medium, respectively. The working concentrations of NTF1, WP1066, and PD0325901 were 1 µg/mL, 10 µM and 1 µM, respectively. *, p ≤ 0.05; **, p ≤ 0.005; ***, p ≤ 0.0005; ns, not significant.

