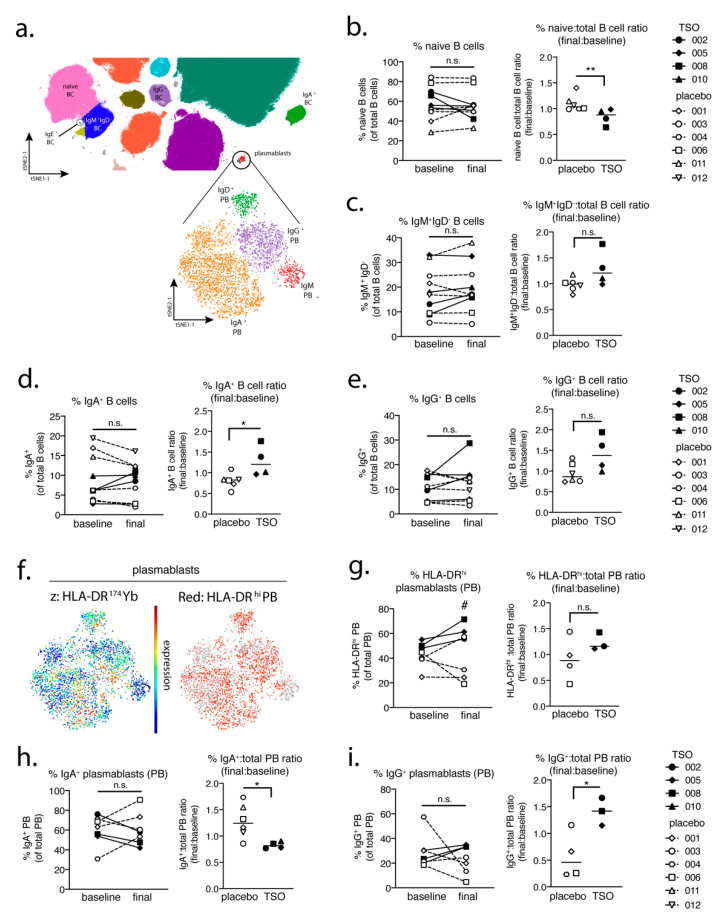
Figure 3.
MS patients given TSO treatment display elevated frequencies of memory B cell subsets and a shift towards an IgG+ phenotype in the plasmablast (PB) compartment. (a) Extract of the tSNE plot from Figure 1; major B cell and PB populations are indicated. Frequencies of major B cell subsets (left) and ratios of these B cell subset frequencies among total B cells (final:baseline) (right) shown for (b) naive B cells, (c) IgM+IgD− B cells, (d) IgA+ B cells, and (e) IgG+ B cells. (f) tSNE visualization of HLA-DR expression in the major plasmablast populations (lower panel in (a)). Plasmablast subset frequencies and final:baseline ratios of each subset among total plasmablasts for (g) HLA-DRhigh PB, (h) IgA+ PB, and (i) IgG+ PB. The following time points were analyzed as “baseline” and “final” for each patient: months 0 and 12 (placebo patient 001), months 3 and 6 (placebo patient 003), months 0 and 9 (placebo patient 004), months 0 and 12 (placebo patient 006), months 0 and 12 placebo (patient 011), months 0 and 12 (placebo patient 012), months 0 and 12 (TSO patient 002), months 0 and 3 (TSO patient 005), months 0 and 3 (TSO patient 008) and months 0 and 12 (TSO patient 010). The calculated ratio values were tested for normal distribution using the Shapiro–Wilk normality test, followed by unpaired t-test or Mann–Whitney U test. *, p < 0.05; **, p < 0.01, n.s., not significant. In (g) # p < 0.05 comparing differences in the frequencies of HLA-DRhi plasmablasts at the final timepoint between the TSO-treated patient group and placebo-treated group.

