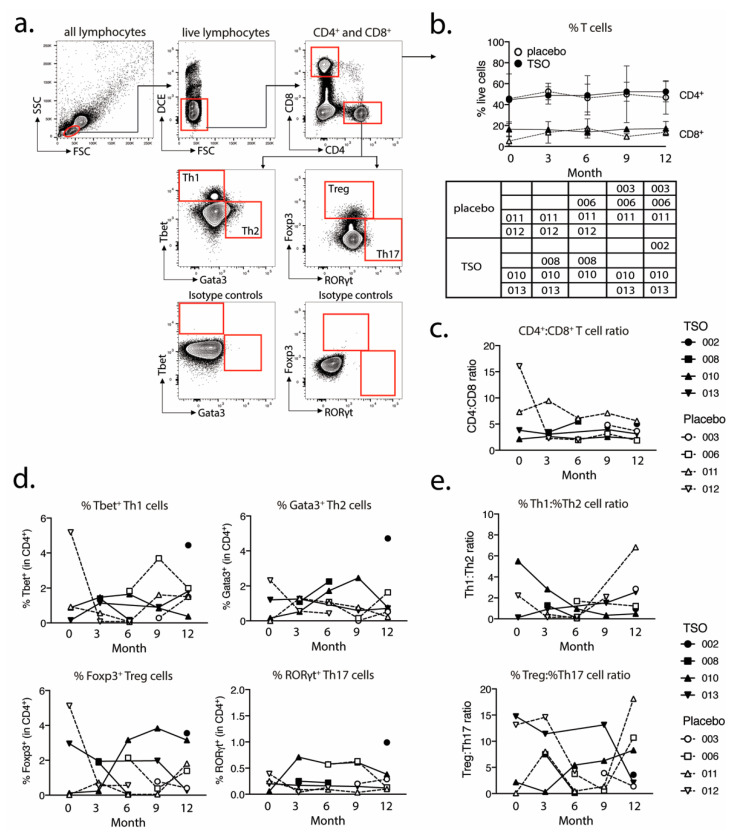
Figure 5.
Placebo and TSO-treated patients display variable kinetics of circulating T helper cell subsets. (a) Gating strategy for flow cytometry analysis of Th1, Th2, Treg, and Th17 cell frequencies in PBMC samples of placebo and TSO-treated patients. Cells were initially gated on lymphocytes, based on their small size measured by forward (FSC) and side scatter (SSC) parameters. Within all lymphocytes, live cells were gated based on their negative expression of the dead cell exclusion dye (DCE). Within live lymphocytes CD4+ and CD8+ T cells were gated for further analysis. Within the CD4+ T helper cell gate, we defined the four major T helper cell subsets based on their expression of the transcription factors Tbet (Th1), Gata3 (Th2), Foxp3 (Treg), and RORγt (Th17), respectively. Respective isotype controls of the transcriptional factor stainings are depicted in the two lower plots. (b) Kinetics of total CD4+ and CD8+ T cell frequencies in placebo-treated and TSO-treated patients. The table under the graph indicates which patient samples were analyzed for each visit. (c) CD4:CD8 T cell ratio kinetics, based on the data in (b). (d) Kinetics of the frequencies of Tbet+ Th1 cells, Gata3+ Th2 cells, Foxp3+ regulatory T cells (Treg), and RORγt+ Th17 cells in placebo-treated and TSO-treated patients. (e) Ratios of Th1:Th2 and Treg:Th17 cells, based on the data in (d).

