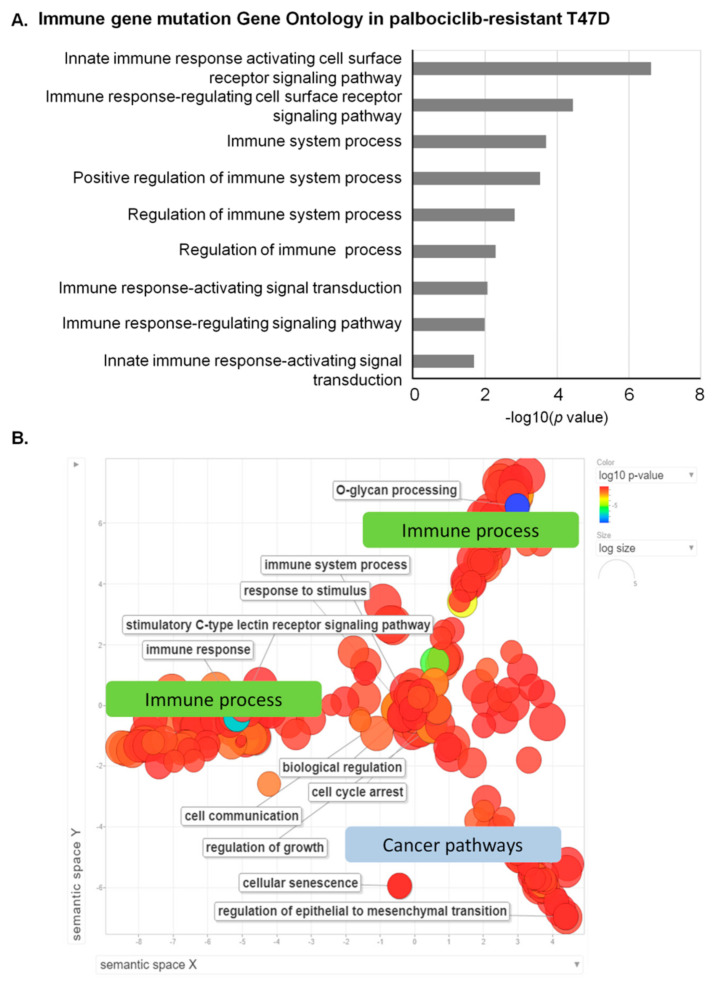
Figure 3.
Mutation profiling in T47D or T47D-PR cells revealing immune pathway deregulation in palbociclib-resistant cells. (A) Mutations were identified according to the Genome Analysis Toolkit v3.4.0 following their best practice guidelines as described in the Methods section. The bar graph shows that GO Biological Process terms related to immune response were enriched in genes with mutations occurring in T47D or T47D-PR cells. The X axis indicates p values in the specified formula −log 10 (p value). The bar represents the statistical significance of each GO term. All GO terms in Figure 3 were statistically significant (adjusted p value < 0.25). The gene list of each GO term overlapping with genes with mutations is provided in Table 2. (B) Visualization of GO enrichment in mutated genes from T47D or T47D-PR cells revealed prominent immune process involvement in palbociclib-resistant cells. The scatterplot of representative GO terms shows the relationship between significantly enriched GO terms and genes with driver or pathogenic mutations occurring in T47D cells. The color of the circle indicates the statistical significance of the GO term in log10 of the p value. The most significant GO terms are shown in blue, while those with the lowest significance are presented in red. The size of the circle indicates the frequency of the GO term in the GO database, with more general GO terms having a larger size. There are three clusters in the semantic space of the scatterplot. The two clusters in the upper part are related to the immune process, while the other one in the lower part is related to cancer pathways.

