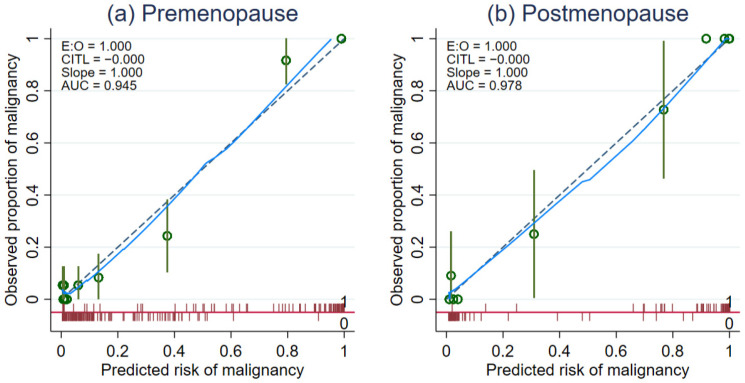
Figure 2.
Calibration plots examining agreement between predicted risk of malignancy from the combined IOTA Simple Rues models (IOTA SR X CA-125) for premenopausal and postmenopausal women and the observed proportion of malignancy stratified by menopausal status. Evaluation of model calibration in (a) premenopausal women and (b) postmenopausal women. The diagonal green dash line is given as a reference for perfect model calibration. The observed proportion of ovarian malignancy at each coordinating predicted risk level is shown with green hollow circles with confidence intervals. The blue line is a lowess smoother visualizing the overall trend of calibration. The spike plot is shown in red to visualize the distribution of events and non-events across the predicted risk of malignancy.

