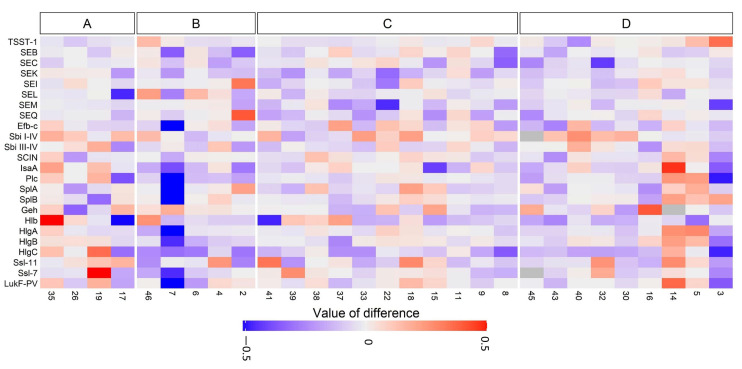
Figure 3.
Heat map presenting changes in IgG responses toward staphylococcal antigens in serum from 29 CRS patients at initial collection (C1) and after 8–15 years (C2; mean follow-up: 11 years). Serum samples were available from 29/34 (85%) CRS patients at both time points. (A) Patients with S. aureus only at C2, (B) patients with S. aureus only at C1, (C) patients with S. aureus at both C1 and C2, and (D) patients with no S. aureus at either C1 or C2. Patient ID is indicated on the X-axis.

