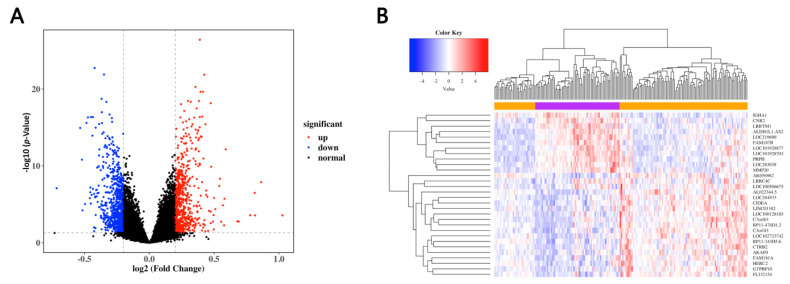
Figure 2.
Identification of the DEGs in GES98793. (A) Volcano plots of differentially expressed genes (DEGs) in the MDD patients and healthy controls. The red and blue dots represent the up-regulated and down-regulated genes, respectively, while the black dots refer to the non-DEGs. (B) Heat map of the top 50 DEGs in the MDD patients and healthy controls.

