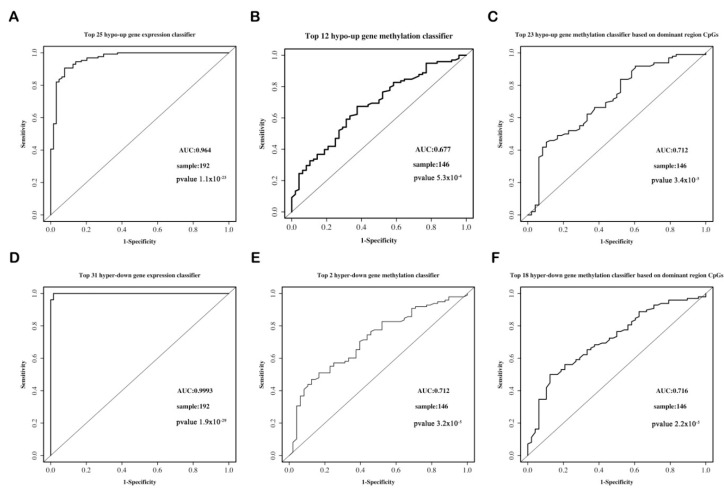
Figure 9.
ROC curves for the hypo-up genes and hyper-down gene classifiers. (A) Top 25 hypo-up gene expression classifier. (B) Top 12 hypo-up gene methylation classifier based on the CpGs in all of the regions. (C) Top 23 hypo-up gene methylation classifier based on the CpGs in the dominant regions. (D) Top 31 hyper-down gene expression classifier. (E) Top 2 hyper-down gene methylation classifier based on the CpGs in all of the regions. (F) Top 18 hyper-down gene methylation classifier based on the CpGs in the dominant regions. ROC, receiver operating characteristic; AUC, area under the curve.

