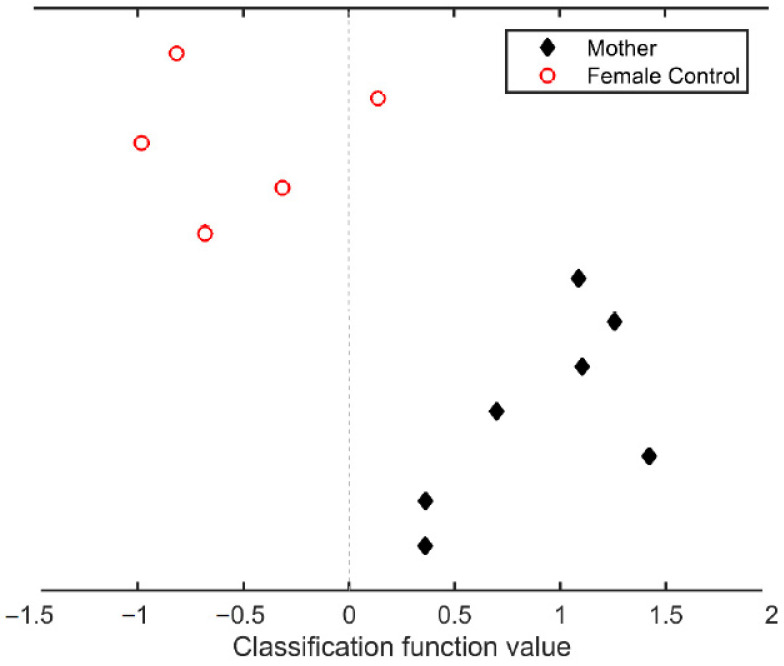
Figure 3.
Classification analysis based on the gray matter volume changes between pre-pregnancy and six years after parturition sessions. Black diamonds represent the mothers, and white circles represent the nulliparous women. The dashed line is the cutoff function value between both groups. Classification function values (mean ± s.d.) for mothers and for nulliparous women are 0.899 ± 0.428 and −0.530 ± 0.448, respectively.

