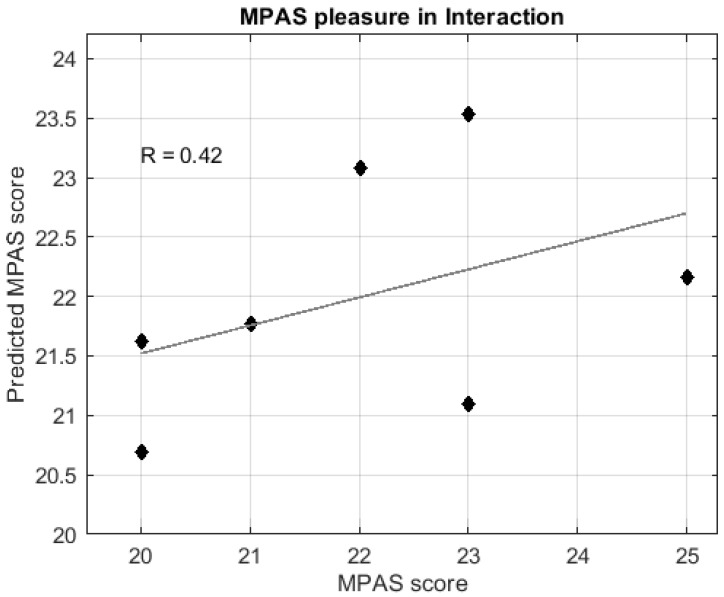
Figure 4.
Regression analysis of the postpartum MPAS subscale of “Pleasure in Interaction” based on the gray matter volume changes between pre-pregnancy and six years after parturition sessions. The graph shows predicted (X-axis) versus actual “Pleasure in Interaction” MPAS score (Y-axis). The mean value (±s.d.) of the predicted score is 22.127 (±1.140), the correlation coefficient with the actual score is (R) = 0.65, p-value = 0.020, nMSE = 0.330, and pnMSE = 0.017. Abbreviations are as follows: MPAS = maternal postpartum attachment scale, s.d. = standard deviation, nMSE = normalized mean squared error, pnMSE = p-value of normalized mean squared error.

