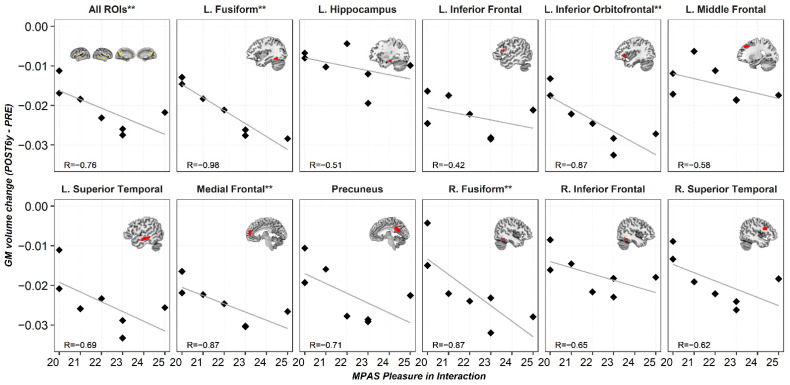
Figure 5.
Scatter plots for the Spearman correlations: Y-axis represents gray matter volume changes (POST6y-PRE) for every region of interest, and X-axis represents postpartum scores in the MPAS subscale of “Pleasure in Interaction.” Abbreviations are as follows: L. = left hemisphere, R. = right hemisphere, PRE = pre-pregnancy session, POST6y = six years after parturition session, MPAS = maternal postpartum attachment scale, R = Spearman correlation coefficient, and FDR = false discovery rate. ** Asterisks indicate correlations at q < 0.05 FDR-corrected for multiple comparisons.

