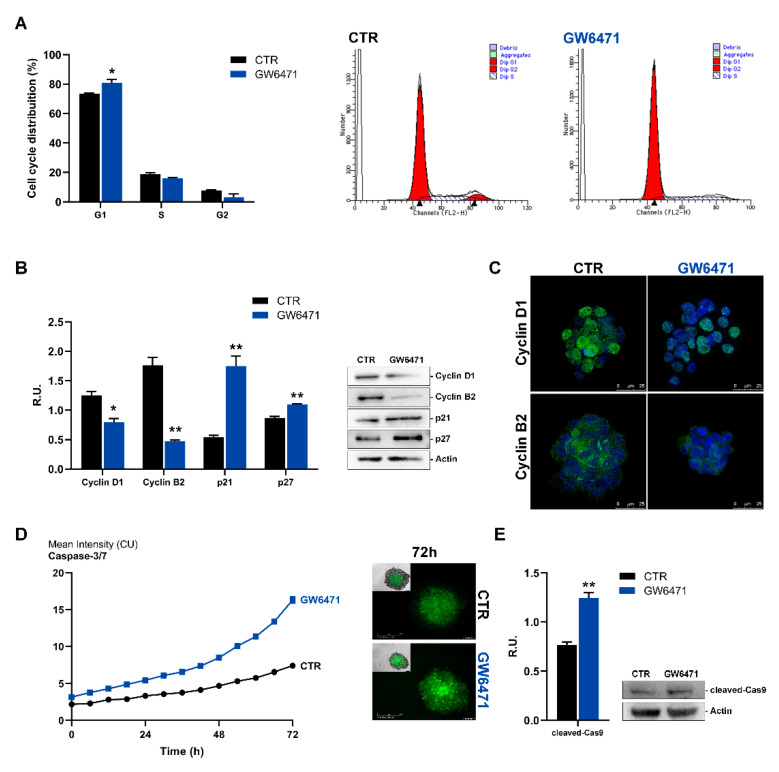
Figure 2.
(A) Cell cycle analysis evaluated by FACS for control and treated mammospheres. (B) Western Blotting analyses for Cyclin D1, Cyclin B2, p21, p27 for control and treated cells. A representative Western blot image is shown for each protein assayed. (C) Immunofluorescence analyses for Cyclin D1 and B2 (green) in control and treated mammospheres. In blue, the DAPI staining is shown. Scale bar: 25 µm. (D) Live-cell Caspase-3/7 assay for control and treated cells (marked in green). Scale bar: 300 µm (E) Western blotting for cleaved Caspase9. A representative western blot image is shown. ** p < 0.005; * p < 0.05 vs. CTR (n = 3). For p values relative to IncuCyte assay please see Supplementary Table S1.

