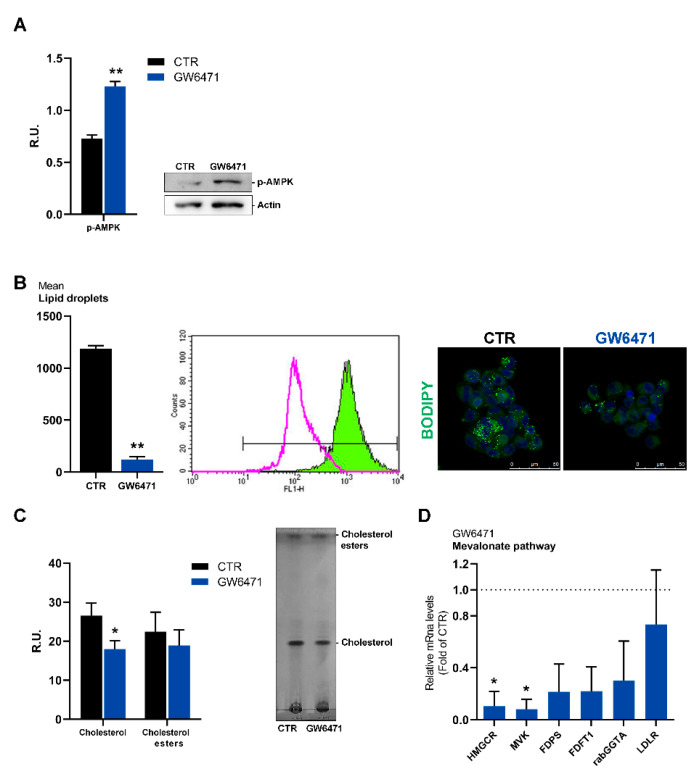
Figure 3.
(A) Western blot and relative densitometric analyses for p-AMPK in control and treated mammospheres. A representative western blot image is shown. ** p < 0.005 vs. CTR (n = 3). (B) Lipid droplets analyzed by cytofluorimetry and immunofluorescence. ** p < 0.005 vs. CTR (n = 3). In the cytofluorimetry, in magenta the ctr is shown, while in green the GW6471-treated cells. In the immunofluorescence figure, in blue the DAPI staining is shown, while in green Bodipy marked cells. A representative image is reported. Scale bar: 50 µm (C) Analyses of the cholesterol content by thin-layer chromatography. * p < 0.05 vs. CTR (n = 3). (D) Rate-limiting enzyme of the mevalonate pathway evaluated by real-time PCR in control and treated mammospheres. * p < 0.05 vs. CTR (n = 3). Dot line indicates the fold of CTR.

